Gyronomics.
ΕΛ

The pita gyro in 2026

Gyro price, net minimum wage and purchasing power for 2026, with its calculation and sources. Visitor reports are shown separately for comparison.

Index · classic gyros / month

214

Using the model's product rescaling

Wage · monthly equivalent

919.72 €

in 2026 prices: 919.72 €

Gross minimum by month: Jan-Mar €880, Apr-Dec €920. Year mean €910. After contributions, before income tax. Annual income divided by 12, using 14 payments throughout the series. Wage and contributions are twelve-month means. Purchasing power in classic gyros.

Minimum Wage: payments, contributions and the reconstruction comparison

The same wage, two comparisons

Period gyros

Price per gyro
4.30 €
With the net minimum wage / month
214

Series range: 3.87 € – 4.73 €

The wrap of the period, at the historical series price. The price may be documented or estimated, as explained in the year’s sources.

Range from price bounds: 194–238 period gyros/month

How is it calculated?

Base series · period gyros/month · scenario start 1998

919.72 € ÷ 4.30 € ≈ 214 period gyros/month

After contributions, before income tax. Annual income divided by 12, using 14 payments throughout the series. Wage and contributions are twelve-month means. Purchasing power in period gyros.

The quotient is rounded to a whole number.

Only the price varies within its published bounds. Wage and composition stay fixed. This is neither a total uncertainty range nor a statistical confidence interval. Bounds come from the model's selected percentage band.

Soft anchor

The price blends the CPI path with the anchor input, is constrained by its range and is rounded to menu-price steps. The input does not directly replace the final price.

3 sources, rescaled to the reference basket: ant12026 EUR 4.25 -> EUR 4.25 (35%) · psitopoles2026 EUR 3.95 -> EUR 3.95 (27%) · gyronomics2026 EUR 4.12 -> EUR 4.12 (39%). Weighted mean EUR 4.12.

Anchors used by the calculation: 2026

The era view applies no meat-weight or composition rescaling to a classic product.

What do the sources support?

B: Regulated, single-source or an estimate with a range

Categories describe how the price enters the model. They do not certify original-source verification, representative sampling or historical product composition.
Selected-series data · 2026.10.10-monthly-bulletin

Classic gyros

Price per gyro
4.300 €
With the net minimum wage / month
214

Rescaled to a common reference product with 88 g of gyro meat and fries. A calculated price, not a second observed shop price.

Range from price bounds: 194–238 classic gyros/month

How is it calculated?

Base series · classic gyros/month · scenario start 1998

919.72 € ÷ 4.300 € ≈ 214 classic gyros/month

After contributions, before income tax. Annual income divided by 12, using 14 payments throughout the series. Wage and contributions are twelve-month means. Purchasing power in classic gyros.

The quotient is rounded to a whole number.

Only the price varies within its published bounds. Wage and composition stay fixed. This is neither a total uncertainty range nor a statistical confidence interval. Bounds come from the model's selected percentage band.

Soft anchor

The price blends the CPI path with the anchor input, is constrained by its range and is rounded to menu-price steps. The input does not directly replace the final price.

3 sources, rescaled to the reference basket: ant12026 EUR 4.25 -> EUR 4.25 (35%) · psitopoles2026 EUR 3.95 -> EUR 3.95 (27%) · gyronomics2026 EUR 4.12 -> EUR 4.12 (39%). Weighted mean EUR 4.12.

Anchors used by the calculation: 2026

Product rescaling

4.30 € × 1.000 ≈ 4.300 €

Model / reference grams:
88 / 88
Meat-component weight:
70%
Fries input in the composition component:
100%
Non-meat base / meat-component cap:
0.65 / 1.35

Historical meat weights and changes in composition are model assumptions, not a series of market measurements. The assumed peak and decline in portion size need verification. The present-day weight defines the reference product. The era price refers to the wrap sold at the time; the classic price and weight-adjusted index depend on these assumptions.

What do the sources support?

B: Regulated, single-source or an estimate with a range

Categories describe how the price enters the model. They do not certify original-source verification, representative sampling or historical product composition.
Selected-series data · 2026.10.10-monthly-bulletin

Both prices are expressed in money of the same year. Classic rescaling adjusts composition, not inflation.

What does the comparison assume?

Historical meat weights and changes in composition are model assumptions, not a series of market measurements. The assumed peak and decline in portion size need verification. The present-day weight defines the reference product. The era price refers to the wrap sold at the time; the classic price and weight-adjusted index depend on these assumptions.

Compare 2026 with another year

Period and classic gyro prices, wage and purchasing power, with downloadable image and CSV.

Compare: 2026 → 2025

Which findings hold up?

We combine 2 wage bases, 4 historical-price choices and 7 composition specifications across 50 completed years, 1976–2025.

Counts are not probabilities. Payroll reconstruction remains under review. Portion scenarios are not measurements; geography and sale channel stay fixed.

Period gyros

8 distinct combinations. Portion assumptions do not affect this measure.

2026 is excluded from completed-year rankings and findings.

Separate and joint peak tests
Peak years by test family
VaryCasesPeak years
Prices only41982, 1984
Wage only21982
Composition only11982
Joint81982, 1984

Separate tests keep other assumptions at the published baseline. Groups overlap and must not be added together.

One example combination for each peak year

  • 1982: Published income · Published baseline
  • 1984: Published income · Without the 1983 price

Classic equivalents

56 distinct combinations.

2026 is excluded from completed-year rankings and findings.

Separate and joint peak tests
Peak years by test family
VaryCasesPeak years
Prices only41985, 1989
Wage only21989
Composition only71982, 1985, 1989
Joint561982, 1984, 1985, 1989

Separate tests keep other assumptions at the published baseline. Groups overlap and must not be added together.

One example combination for each peak year

  • 1982: Published income · Published baseline · Reference meat weight in every year
  • 1984: Published income · Without the 1983 price · Reference meat weight in every year
  • 1985: Published income · Published baseline · Historical meat -20%
  • 1989: Published income · Published baseline · Baseline composition
Specifications and how to verify the result

Wage

  • Published income
  • Payroll reconstruction under review

Price

  • Published baseline
  • Without the 1983 price
  • Without the 1984 price
  • Without either price

Composition

  • Baseline composition
  • Historical meat -20%
  • Historical meat +20%
  • Reference meat weight in every year
  • Meat value share 50%
  • Meat value share 90%
  • No non-meat composition gap

JSON includes parameters, inputs, public citations and every case by year. CSV contains the same calculations. With Node 24, the standalone program checks the arithmetic without packages, network or private repository access. Arithmetic reproduction does not certify historical sources.

node reproduce-joint-v1.mjs joint-robustness-2026-09-14.json

joint-robustness-v1 · 2026.09.26-mean-wage-source

Where this figure comes from

Soft anchor. The price blends the CPI path with the anchor input, is constrained by its range and is rounded to menu-price steps. The input does not directly replace the final price.

Catering CPI projection: 4.17 € (2025) × (1 + 6.7%) = 4.45 €. Blend of the year's evidence 4.12 € (ANT1: 34.6%, enikonomia.gr: 26.9%, Gyronomics: 38.5%). Projection weighted 50% and evidence 50%: 4.28 €. Range of the sources 3.70 € - 5.00 €. No fall below 4.17 €. Menu-price step 0.05 €: 4.30 €.

4.30 € and 214 classic gyros for 2026 hold while the annual catering CPI (CP11.1.1) stays at or above 6.3%, as it enters the series to one decimal (the rule's threshold is 6.28%). With 8 months published, at the close of the year this means a Sep-Dec mean of at least 5.30%. If it comes in lower, the same rule gives 4.25 € and 216 classic gyros. At 8.7% or more it would give 4.35 € and 211. Each new Eurostat month enters the series with a new data release.

The era price is an input or calculation in the series. Comparison in classic gyros adds assumptions about weight and composition.

BRegulated, single-source or an estimate with a rangeFries includedSkewer (estimate): 2.11 €

Categories describe how the price enters the model. They do not certify original-source verification, representative sampling or historical product composition.
Detailed evidence and calculation

What is supported for this year

We examine price, date, place and product composition separately. Evidence for the price does not establish historical meat weights.

The detailed year review is pending. This does not mean no sources exist.

Price
Sources and the calculation are shown below. A separate review of these dimensions has not yet been completed for this year.
Date
A separate check of publication date and observation date has not yet been completed here.
Geography
A separate review of geographical coverage and adjustments has not yet been completed here.
Composition
Historical meat weights and changes in composition are model assumptions, not a series of market measurements. The assumed peak and decline in portion size need verification. The present-day weight defines the reference product. The era price refers to the wrap sold at the time; the classic price and weight-adjusted index depend on these assumptions.
See sources for this year

From source to series price

A source entry is not always the final price. These are the inputs retained by the model, without implying fresh verification of the original.

  1. 1. Amount before rescaling

    4.25 €

    The recorded original amount before any rescaling. It may be a regulated ceiling or composite input, not an individual purchase.

  2. 2. Model input

    4.12 €

    3 sources, rescaled to the reference basket: ant12026 EUR 4.25 -> EUR 4.25 (35%) · psitopoles2026 EUR 3.95 -> EUR 3.95 (27%) · gyronomics2026 EUR 4.12 -> EUR 4.12 (39%). Weighted mean EUR 4.12.

  3. 3. Period price in the series

    4.30 €

    The final price used for period purchasing power. Classic composition rescaling is a separate subsequent step.

In some years an anchor constrains the range rather than replacing the calculated price. Historical amounts use the fixed drachma-to-euro conversion, without inflation adjustment.

Dates and references for each observation
  • ΑΝΤ1 (Αύγ. 2026) - πανελλαδική καταγραφή τιμών τυλιχτού ανά πόλη

    Published: Not established

    Observation period: Not separately recorded

    ANT1 survey (Aug 2026): Athens EUR 3.80-5.00, Thessaloniki up to EUR 5.30, Crete up to EUR 6.50, with a reported national average of EUR 4.00-4.50. The midpoint of EUR 4.25 is used, with the Athens range. This is a selected range midpoint, not a computed shop median.

      No specific publication has been mapped to this observation.

    • Πρόεδρος Ψητοπωλών Αττικής (2.5.2026) - μέσες τιμές take away και delivery

      Published: Not established

      Observation period: Not separately recorded

      President of the Attica grill owners (2 May 2026): pork/chicken pita take-away 3.70-4.20 EUR, midpoint 3.95 EUR. Before 28 Feb 2026 it was 3.50 EUR. By delivery or eaten in, 4.00-4.50 EUR, which is not entered here so the same market is not counted twice.

        No specific publication has been mapped to this observation.

      • Gyronomics (Σεπτ. 2026) - δική μας μέτρηση σε 1.660 καταστήματα, 78 πόλεις

        Published: Not established

        Observation period: Not separately recorded

        Our own pilot reading, September 2026: 1,660 shops in 78 cities from public platform listings. The platform median is adjusted to a counter price using the channel factor. A convenience sample, not a representative national survey.

          No specific publication has been mapped to this observation.

        Sources and limitations for this year

        How the number is produced

        Every figure with the formula that produces it and its source. Nothing is written by hand.

        The wage

        Gross, per payment
        910.00 €
        Employee contributions
        13.37%
        Net, per payment
        netPerPayment = gross × (1 − contributionRate)788.33 €
        Payments per year
        14
        Net, on a 12-month basis
        netEur = netPerPayment × payments ÷ 12919.72 €

        Ministry of Labour - Decision 8934/2026, minimum wage

        The price

        Price(soft model anchor)
        4.30 €
        Uncertainty range(−10.00% / +10.00%)
        3.870 € - 4.730 €
        Method
        catering-cpi-with-soft-anchor

        Gyronomics - our own price reading across 1,660 shops

        From projection to price

        2025 price
        4.17 €
        Catering CPI projection
        projected = previousPrice × (1 + rate ÷ 100)4.45 €
        Evidence blend(ANT1: 34.6%, enikonomia.gr: 26.9%, Gyronomics: 38.5%)
        4.12 €
        Evidence weight
        50.0%
        Weighted mean
        4.28 €
        Range of the sources
        3.70 € - 5.00 €
        No-fall floor
        4.17 €
        Menu-price step
        0.05 €
        Series price
        4.30 €

        price = round(max(clamp((1 − w) × projected + w × anchor, softMin, softMax), floor) ÷ step) × step

        The index

        Index
        index = round(netSalary / pitaPrice)214
        Change vs previous year
        +4
        In the hypothetical scenario(general)
        609
        Wage in today's prices
        real = net × (CPI_2026 / CPI_year)919.72 €

        How to cite it

        3 sources, rescaled to the reference basket: ant12026 EUR 4.25 -> EUR 4.25 (35%) · psitopoles2026 EUR 3.95 -> EUR 3.95 (27%) · gyronomics2026 EUR 4.12 -> EUR 4.12 (39%). Weighted mean EUR 4.12.

        Rescaling scenario: Base series (anchors, estimates and derived prices)

        Sources for this year

        Citations

        Reproduce this calculationWrapped pita gyro

        3 sources, rescaled to the reference basket: ant12026 EUR 4.25 -> EUR 4.25 (35%) · psitopoles2026 EUR 3.95 -> EUR 3.95 (27%) · gyronomics2026 EUR 4.12 -> EUR 4.12 (39%). Weighted mean EUR 4.12.

        Explore composition assumptions for this year

        Visitor reports

        Loading visitor reports…

        Visitor reports are an independent comparison layer and do not affect the index.

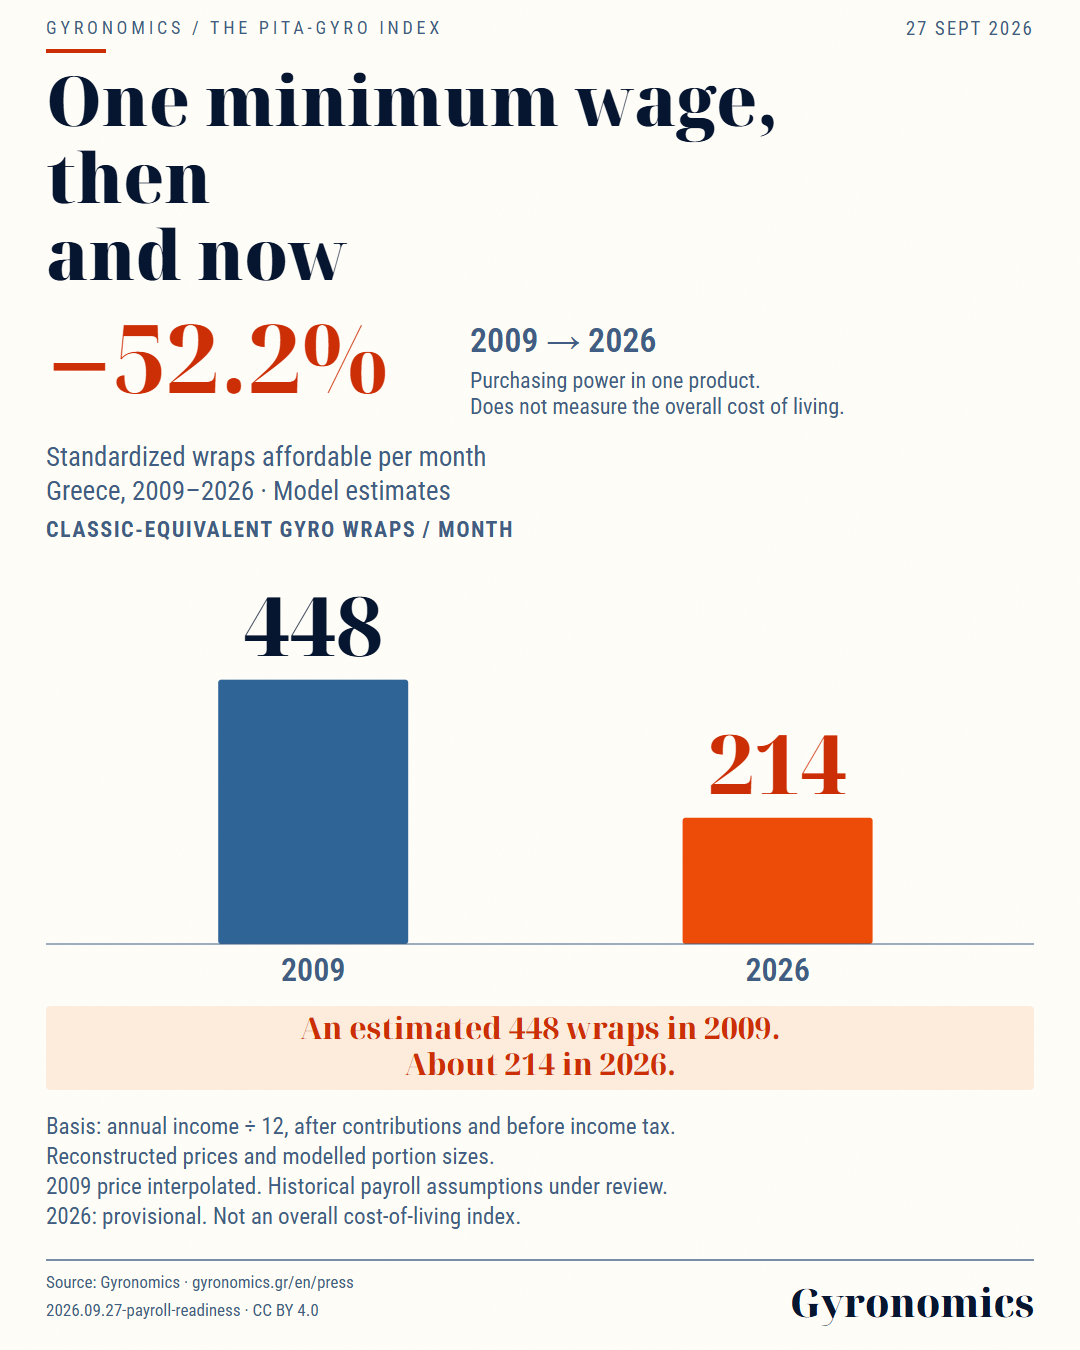
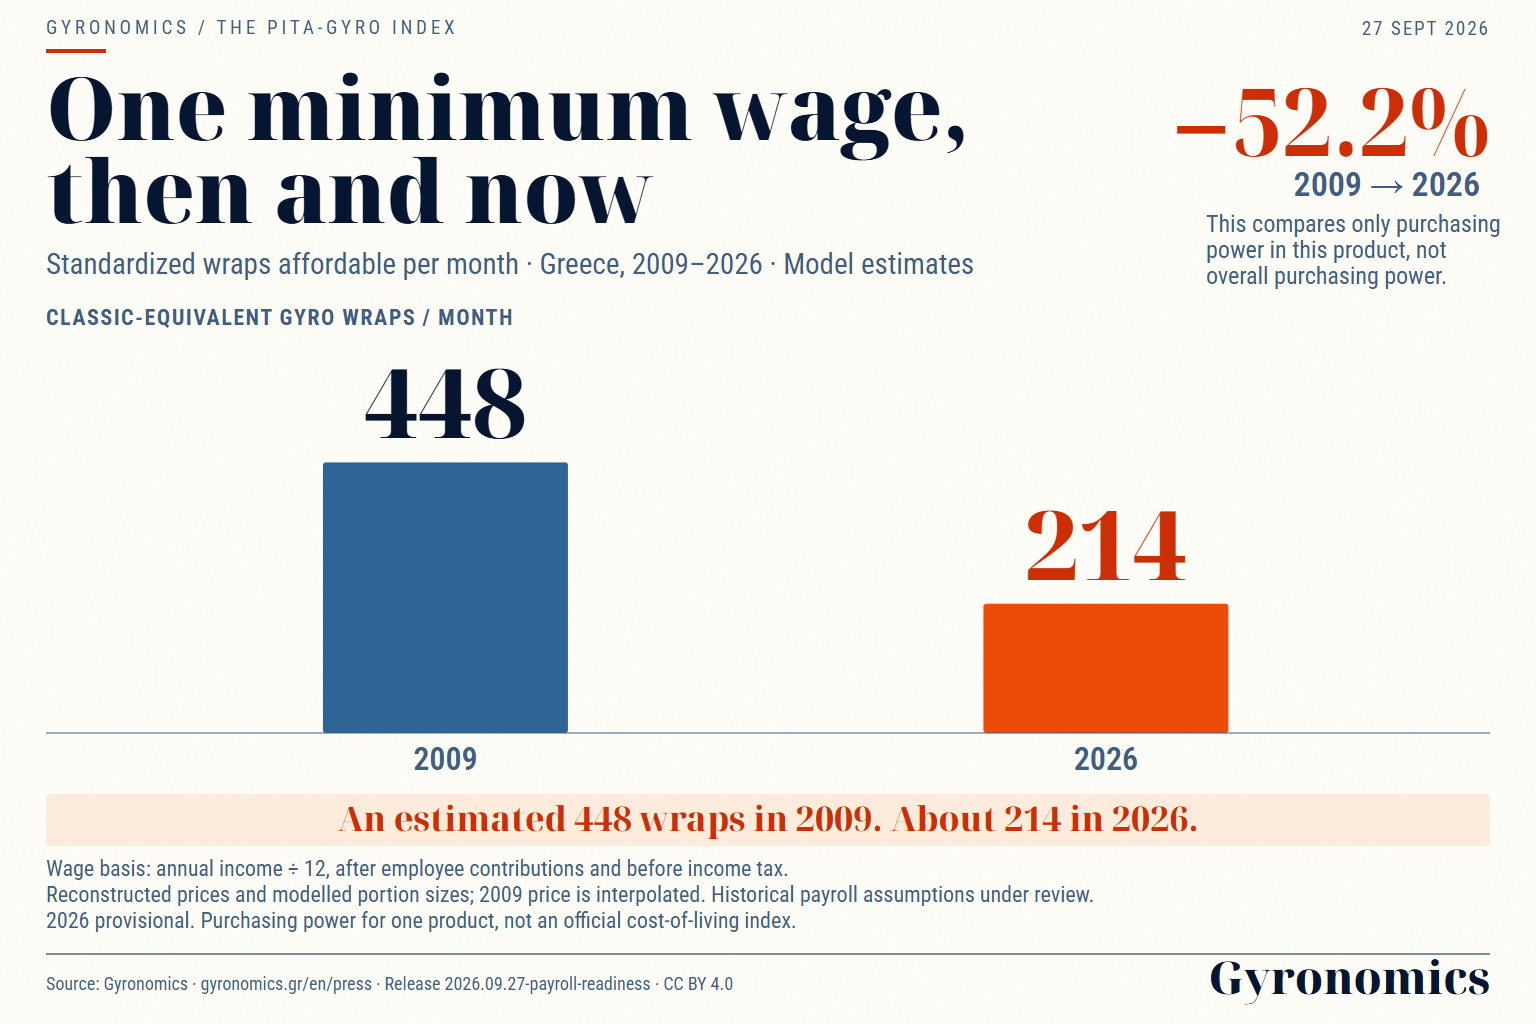
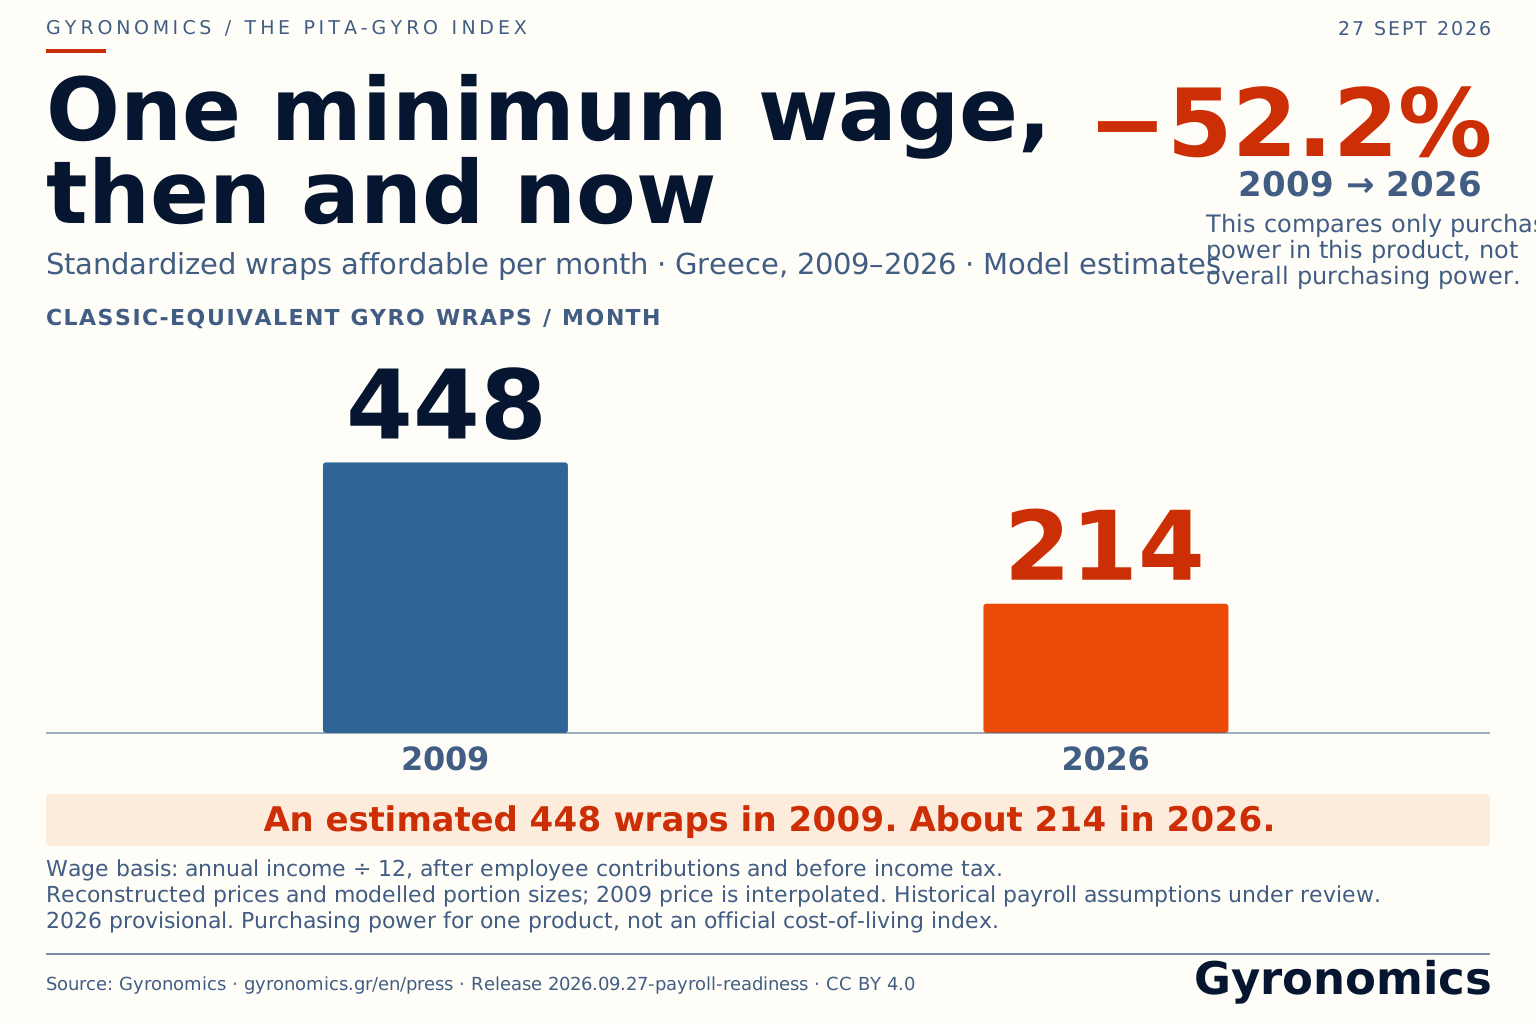
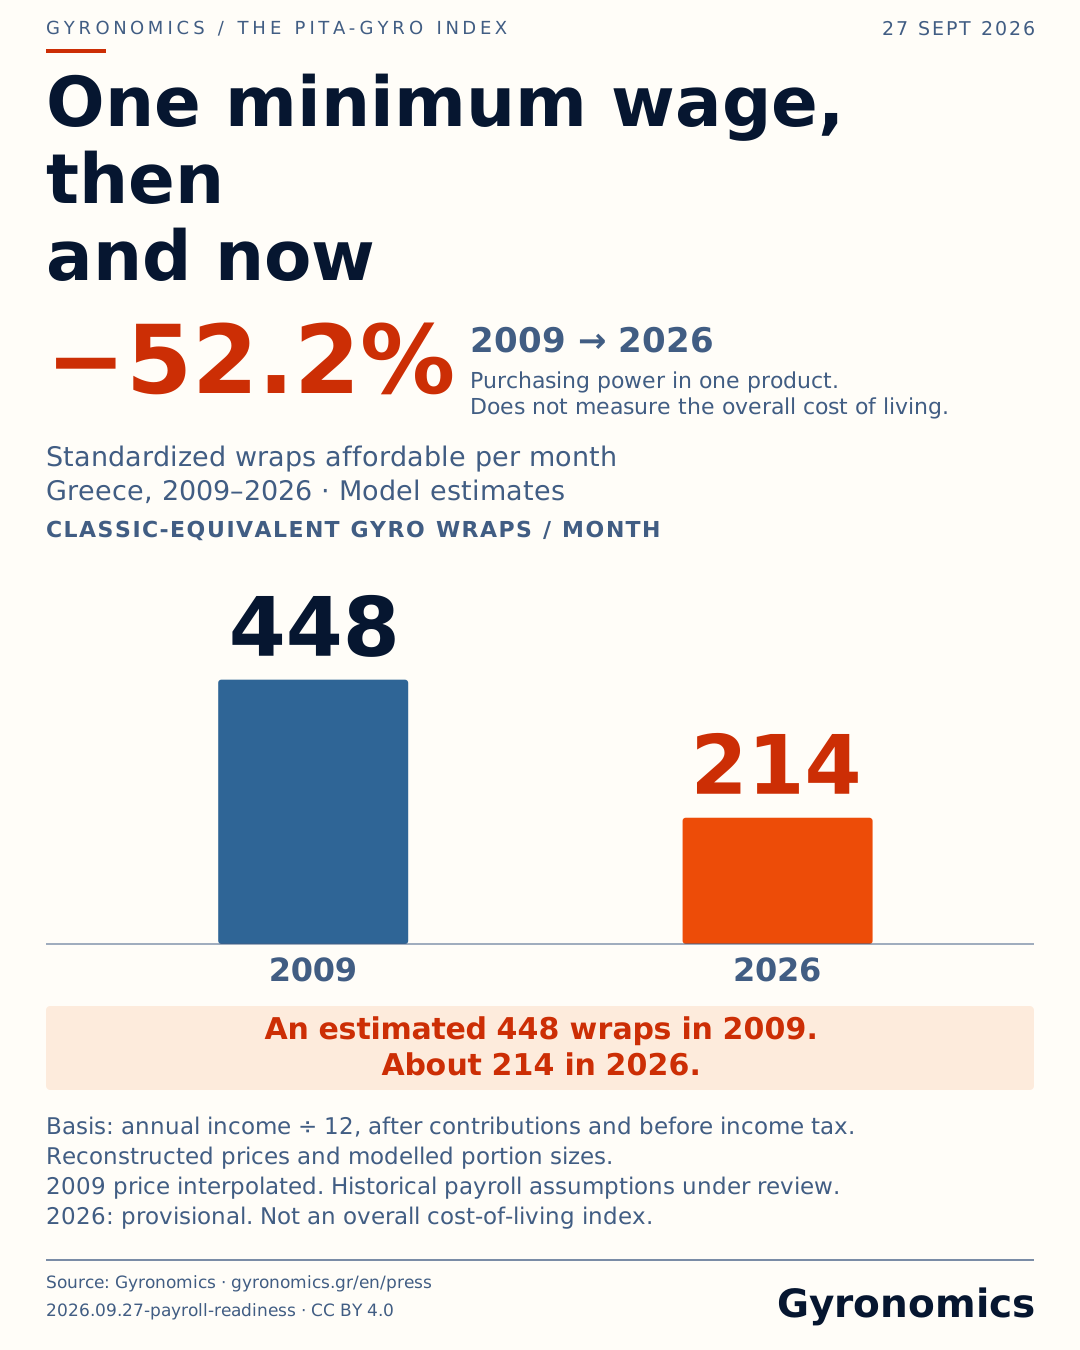
        2009 → 2026: about 448 → 214 classic-equivalent gyros per month. Change: −52.2%, calculated before rounding.

        Then and now

        2009 → 2026: about 448 → 214 classic-equivalent gyros per month. Change: −52.2%, calculated before rounding.

        SVG, source and notes
        • Wage basis: annual income ÷ 12, after employee contributions and before income tax.
        • Reconstructed prices and modelled portions. Historical payroll assumptions remain under review.
        • 2026: provisional. A one-product indicator, not the overall cost of living.

        Release: 2026.09.27-payroll-readiness · CC BY 4.0

        Immutable image dataset
        Figures, calculations and sources →