Gyros by government
How much the wage rose, how much the gyro price rose and how many gyros the net minimum wage buys per month, by government period, 1976–2026. Arithmetic on the Index series, not evidence of cause.
The conclusion at a glance
- The ND minus PASOK difference in gyros per month changes sign at a 9-month lag: with less lag ND comes out lower than PASOK, with more lag higher.
- Of the 9 comparisons (party pairs times quantity), 4 hold under all 50 versions. In gyros per month 0 of 3 hold.
- Hold under all versions:
- ND above SYRIZA in the annual rate: gyro price
- ND above SYRIZA in the annual rate: wage
- PASOK above SYRIZA in the annual rate: gyro price
- PASOK above SYRIZA in the annual rate: wage
The whole series, coloured by government
- Wage
- ×58.58
- 15.70 € → 919.72 €
- Gyro price
- ×86.00
- 0.050 € → 4.30 €
- Gyros per month
- 314 → 214
- −31.9%
How the years are assigned
Measure
Each year goes to the government in office on 30 June of that year.
- New Democracy
- PASOK
- SYRIZA
- Dotted: the year has an interpolated price (grade C or D)
Each segment of the line takes the colour of the government the year's change is assigned to.
By government period
Each row is consecutive years of the same party. The starting point is the end of the year before the period, and the wage, the price and the gyros the wage buys are measured. The evidence line shows how much of the period's price rests on documented evidence and how much on interpolation.
| Period | Wage (€ per month) | Gyro price (€) | Gyros per month | Change |
|---|---|---|---|---|
| ND 1977–81K. G. Karamanlis, G. RallisPrice evidence: D → D, interpolated 3/6 years | 15.70 → 39.17×2.49 · +20.1% a year | 0.050 → 0.108×2.16 · +16.7% a year | 314 → 363+2.9% a year | +15.5% |
| PASOK 1982–89A. PapandreouPrice evidence: D → B, interpolated 6/9 years | 39.17 → 169.01×4.31 · +20.1% a year | 0.108 → 0.335×3.10 · +15.2% a year | 363 → 505+4.2% a year | +39.1% |
| ND 1990–93K. MitsotakisPrice evidence: B → C, interpolated 4/5 years | 169.01 → 273.55×1.62 · +12.8% a year | 0.335 → 0.621×1.85 · +16.7% a year | 505 → 440−3.3% a year | −12.7% |
| PASOK 1994–2003A. Papandreou, C. SimitisPrice evidence: C → C, interpolated 7/11 years | 273.55 → 509.60×1.86 · +6.4% a year | 0.621 → 1.28×2.06 · +7.5% a year | 440 → 398−1.0% a year | −9.6% |
| ND 2004–09K. A. KaramanlisPrice evidence: C → C, interpolated 7/7 years | 509.60 → 712.17×1.40 · +5.7% a year | 1.28 → 1.59×1.24 · +3.7% a year | 398 → 448+2.0% a year | +12.4% |
| PASOK 2010–11G. A. PapandreouPrice evidence: C → B, interpolated 2/3 years | 712.17 → 728.74×1.02 · +1.2% a year | 1.59 → 1.75×1.10 · +4.9% a year | 448 → 416−3.5% a year | −7.0% |
| ND 2012–14A. SamarasPrice evidence: B → C, interpolated 3/4 years | 728.74 → 574.36×0.79 · −7.6% a year | 1.75 → 1.76×1.00 · +0.1% a year | 416 → 327−7.8% a year | −21.5% |
| SYRIZA 2015–19A. TsiprasPrice evidence: C → A, interpolated 4/6 years | 574.36 → 632.89×1.10 · +2.0% a year | 1.76 → 2.07×1.18 · +3.3% a year | 327 → 306−1.3% a year | −6.5% |
| ND 2020–26K. MitsotakisPrice evidence: A → B, interpolated 0/8 years | 632.89 → 919.72×1.45 · +5.5% a year | 2.07 → 4.30×2.08 · +11.0% a year | 306 → 214−5.0% a year | −30.0% |
Grades A to D are the model's: A a documented anchor, B regulated, single-source or an estimate with a range, C and D interpolation. Changes are calculated before the gyros are rounded, so they can differ by 0.1 from the ratio of the integers shown.
Total by party
The factors multiply to the factor of the whole series: the product over all parties gives the wage, the price and the gyros of the whole.
| Party | Years | Wage | Price | Gyros per month |
|---|---|---|---|---|
| ND | 25 | ×6.46+7.8% a year | ×10.38+9.8% a year | ×0.62−1.9% a year |
| PASOK | 20 | ×8.23+11.1% a year | ×7.03+10.2% a year | ×1.17+0.8% a year |
| SYRIZA | 5 | ×1.10+2.0% a year | ×1.18+3.3% a year | ×0.94−1.3% a year |
What survives under all versions
The page does not pick one version. It tries both ways of assigning years at every lag in the range you set below (from 0 to 24 months, 50 versions), and asks in how many one party comes out above the other. If the answer is “all of them”, there is a conclusion. If not, there is none, and that is the finding.
Which lags do you consider plausible?
The lag is not known and the page has no source for how much it is in Greece. It also differs by quantity: the minimum wage is set by decision, while the gyro price also depends on the market. You set the range. The default is the whole range, because the page does not accept any assumption on its own; the verdicts below are recomputed within the range you choose, and it stays in the link.
Range: from 0 to 24 months of lag, 50 versions (both ways).
ND minus PASOK: difference in the annual rate in gyros per month
Percentage points a year. Above zero the first party comes out higher; below, the second. You choose the measure in the overview.
- 30 June (selected)
- By days
- Vertical dotted line: the lag you have selected. Shaded: the range you accept
| Pair | Gyros per month | Gyro price (€) | Wage (€ per month) |
|---|---|---|---|
| ND · PASOK | Changes: ND above in 32 of 50PASOK above from lag 0 to 8 months | Changes: ND above in 39 of 50PASOK above from lag 0 to 3 months | Changes: ND above in 33 of 50PASOK above from lag 0 to 7 months |
| ND · SYRIZA | Changes: ND above in 42 of 50 | ND above in all (50) | ND above in all (50) |
| PASOK · SYRIZA | Changes: PASOK above in 19 of 50PASOK above from lag 0 to 8 months | PASOK above in all (50) | PASOK above in all (50) |
Bold: the conclusion holds under all versions in the range. Light grey: it changes, so there is no conclusion by party for this range. The small line under each cell says up to which lag the conclusion that holds at 0 survives, so it is visible which assumption it depends on.
Stress test: three named versions
The first column, “Your selection”, follows the way and the lag you chose above. The three named columns are fixed and do NOT change with the slider: they stay as points of comparison, so the numbers can be seen side by side. The slider and the chart cover everything in between.
| Gyros per month | Your selection30 June, no lag | 30 June | By days | 12-month lag |
|---|---|---|---|---|
| ND | ×0.62−1.9% a year | ×0.62−1.9% a year | ×0.72−1.4% a year | ×1.010.0% a year |
| PASOK | ×1.17+0.8% a year | ×1.17+0.8% a year | ×1.16+0.7% a year | ×0.70−1.8% a year |
| SYRIZA | ×0.94−1.3% a year | ×0.94−1.3% a year | ×0.91−2.1% a year | ×0.96−0.8% a year |
- In gyros, the ranking of ND and PASOK changes direction between the versions. ND ranges from −1.9% to 0.0% a year and PASOK from −1.8% to +0.8%, depending on the version.
- In the gyro price, ND and PASOK are not consistently apart. The annual rate is around 10% in both: ND 9.8–10.1%, PASOK 10.0–10.2%.
- The 2012 cut and the rule. The minimum-wage cut applies from 14 February 2012, when the prime minister was L. Papademos. On 30 June of that year the prime minister was A. Samaras, so the 30 June rule gives the whole of 2012 to ND.
- Years close to 30 June. In 4 years the change of government falls within 21 days of 30 June, and the rule decides by a few days: 1989 (2 July 1989, T. Tzannetakis), 2012 (20 June 2012, A. Samaras), 2019 (8 July 2019, K. Mitsotakis), 2023 (26 June 2023, K. Mitsotakis).
“What if only this one had governed all fifty years?”
An extrapolation, not a scenario: the party's average annual rate applied to all 50 years, from the starting value of 1976. The wage and the price are each extrapolated at their own rate, and gyros follow as wage ÷ price. The first column follows your selection; the three named ones are fixed. SYRIZA is not computed, since five years cannot carry a fifty-year extrapolation.
| 2026 | Your selection30 June, no lag | 30 June | By days | 12-month lag |
|---|---|---|---|---|
| ND | 655.91 € wage5.39 € price122 gyros per month | 655.91 € wage5.39 € price122 gyros per month | 829.14 € wage5.24 € price158 gyros per month | 1,981.04 € wage6.20 € price320 gyros per month |
| PASOK | 3,046.15 € wage6.56 € price465 gyros per month | 3,046.15 € wage6.56 € price465 gyros per month | 2,886.40 € wage6.38 € price452 gyros per month | 752.89 € wage5.81 € price130 gyros per month |
| Actual | 919.72 € wage · 4.30 € price · 214 gyros per month | |||
The sign of the ND minus PASOK difference in the extrapolation changes between the versions, and the gyros spread over a range that supports no conclusion. That is why the page does not give a “what would have happened”.
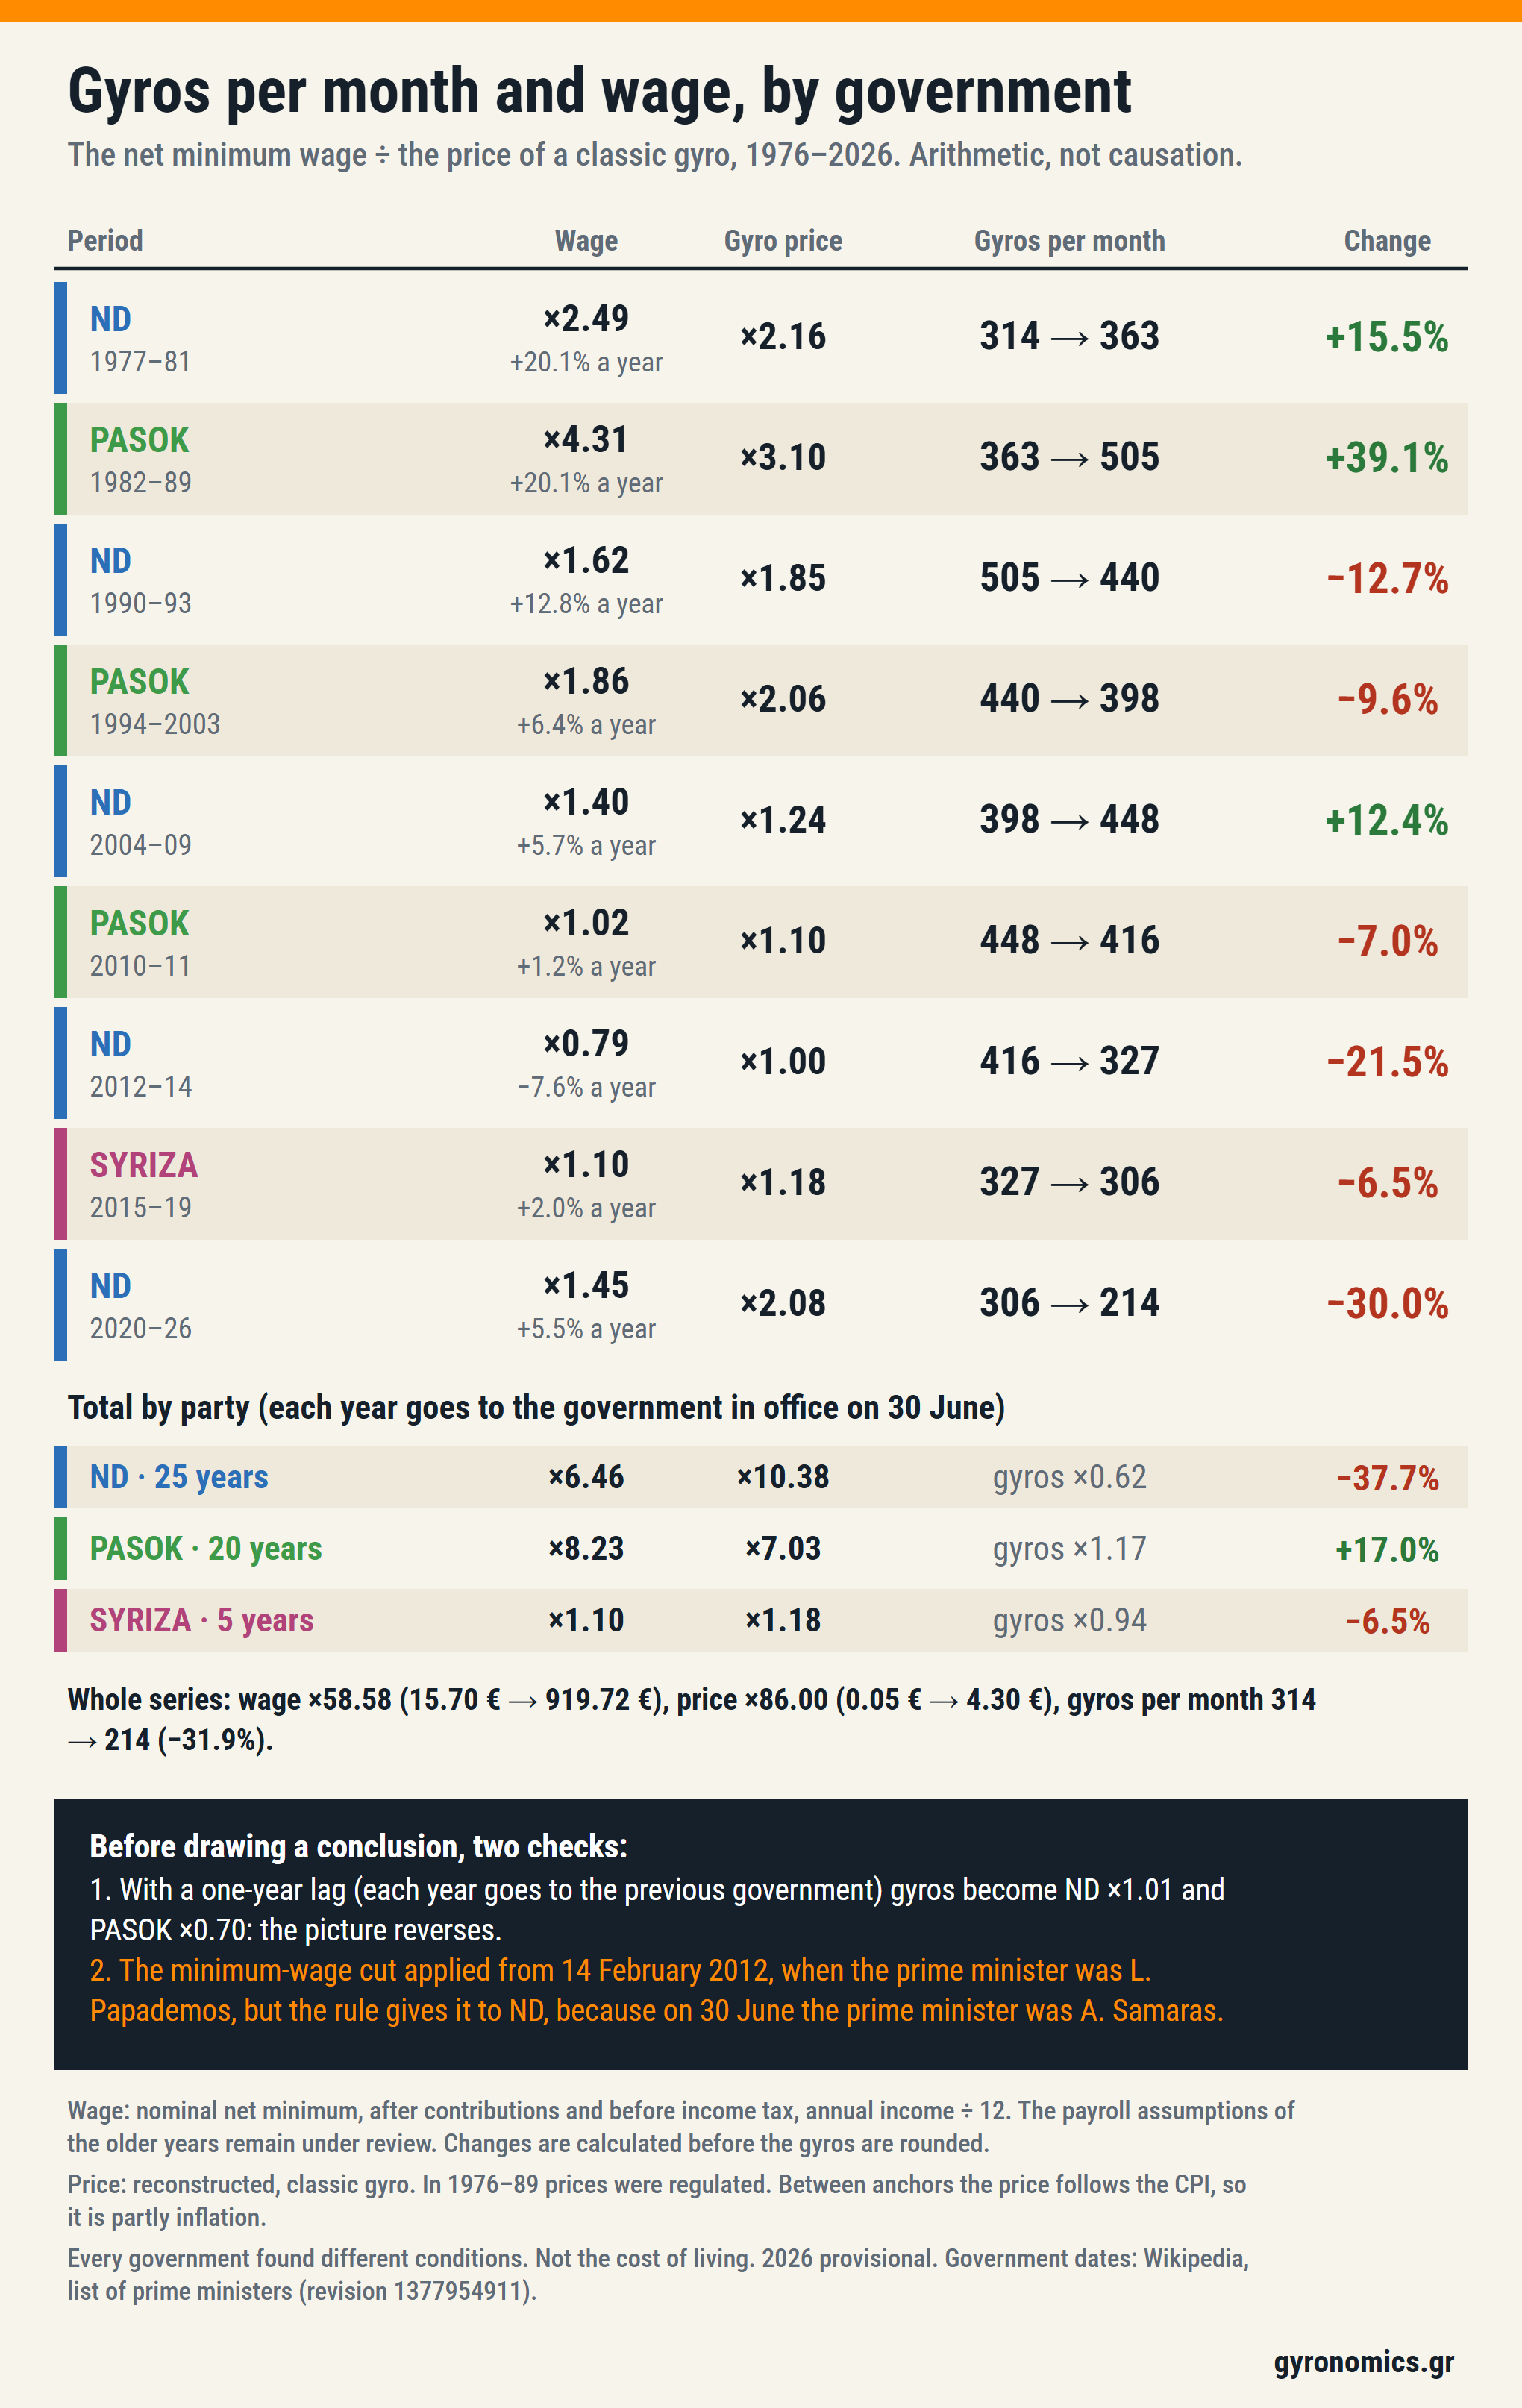
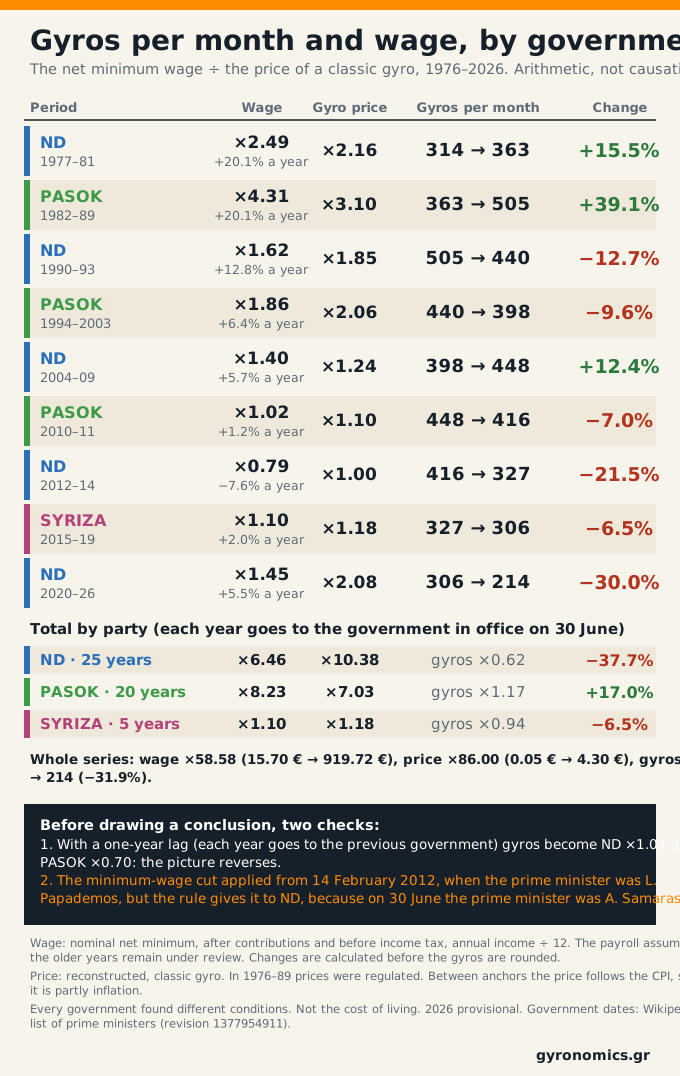
The image, for sharing
The table by period, the totals by party and the two checks in one image, using the 30 June rule. It is generated from the same data as this page and checked in the build, so it cannot disagree with it.
Method and sources
- The three quantities. Wage: the net minimum wage per month (annual income ÷ 12, after contributions and before income tax). Price: the price of a classic gyro. Gyros per month: the wage divided by the price, the same integer as the Index.
- A year's change. The change of year y is the ratio of its value to that of y−1. It is assigned to one government (or split) in one of two ways, for a lag from 0 to 24 months. The 24-month limit is a choice (two years) and fits in the governments table.
- Composition. Changes are composed logarithmically, so the product of the parties' factors equals the factor of the whole series. The annual rate is the geometric mean, and gyros equal the wage factor divided by the price factor, in every period and for every party. The tests check both.
- Evidence for the price. Every year of the series has an evidence grade A to D from the model. The table and the chart show which years are interpolated (C or D), because a period that rests mainly on interpolation deserves less trust.
- Government source. Dates come from the Wikipedia list of prime ministers (revision 1377954911, retrieved 5 October 2026). It is a secondary source, not an official register. The raw file is kept with SHA-256
684bffd718daf5b635cfd3b6c8e992625b92f7e5dfc4c639b89afcb8c7144eca, and a test re-derives every term boundary in the table from it. The party is the one the source gives; caretaker and independent prime ministers are “other”. - Series source. The Index series, with its assumptions and sources, is in the method and the open data.
What this page does not say
- It does not assign responsibility. A government does not set the gyro price or the minimum wage alone. The euro, international meat and energy prices, the debt crisis, the pandemic and war affect all of them. The page describes what happened during each government's years, not why.
- It does not remove the lag to get a conclusion. Lag is the commonest reason a result belongs to the previous government. If the rule that overturns a conclusion were removed, there would be no conclusion, only a choice of the rule one likes. That is why a conclusion by party exists only where it survives under all versions.
- The price is partly inflation. Between anchors the price follows the CPI (general in 1978–88, catering in 1990–97), so for much of the series the comparison between parties is in effect inflation by government. In 2021–2025 the annual price rises are 10–21%, an inflation episode that is not specific to Greece.
- The 1970s and 1980s. In 1976–1989 prices were regulated, and the payroll assumptions of the older years remain under review. The first periods are not directly comparable with periods of free prices, and the evidence line shows how much interpolation they have.
- One product, not the cost of living. What the Index does not measure. 2026 is provisional and the latest government is assumed to continue to the end of the year.
Next: the Index · GYRO/EUR · wage and price · the minimum wage