Gyro Index methodology
The full technical document of Gyronomics: what we measure, where the data comes from, how the index is computed and which limitations apply. This document is updated together with the code and data - the figures you see are pulled live from the model.
For a first reading, start with the definition and one year's calculation. To examine the assumptions, continue to product conversion, uncertainty and limitations. Definition · Calculation · Limitations
1. Abstract
The Gyro Index measures how many classic wrapped gyros (with today's composition: rotisserie meat, fries, tzatziki, tomato, onion) a monthly wage in Greece can buy, for every year from 1976 to 2026. The goal is an intuitive measure of purchasing power: not 'how much does it cost', but 'how many pitogyra does the salary buy'.
Headline finding: the index moves from 314 classic gyros per month in 1976 to 214 in 2026. Peak: 1989 (B) at 505 and 1985 (D) at 504, practically tied; quotients 504.51 and 504.40, and the order changes without the intermediate roundings (504.01 and 504.21). Trough: 2025 (A) and 2026 (B, provisional), both at 214; quotients 213.69 and 213.89. Across the 56 robustness cases the peak falls in 1982 (D), 1984 (B), 1985 (D) or 1989 (B), depending on the assumptions, so the peak year is not a finding. The average annual change over the period is -0.8%, and -2.3% from 1989 to today.
Data last updated:
2. Goal and definition
- Product and unit
- Classic wrapped pork gyro with fries, tzatziki, tomato and onion, defining the reference meat portion as 88 g. Unit: classic equivalents per month. The period price and period index remain separate quantities.
- Wage
- Minimum wage after employee contributions, before income tax. From 1976 and throughout the series it is the mean of the year’s twelve months, using each month’s minimum and contribution rate. Fourteen payments are annualised and divided by twelve. Lower-grade evidence cells in the early period remain separately identified. This is not the mean or median wage of employees.
- Geography
- A reference series for Greece assembled from heterogeneous, often local sources. Geographic adjustments are part of the model. A representative national sample is not available for every year.
- Channel and basket
- The target is a comparable counter price for a wrap. Delivery, platform and mixed-product reports use the declared adjustment factors. Incomplete channel information remains a limitation.
- Reference time
- Each row represents a calendar year in the model. A publication date does not establish a collection date. Some inputs are time-weighted; others are snapshots or retrospective reports. The current year is provisional.
Historical meat weights and changes in composition are model assumptions, not a series of market measurements. The assumed peak and decline in portion size need verification. The present-day weight defines the reference product. The era price refers to the wrap sold at the time; the classic price and weight-adjusted index depend on these assumptions.
3. Key results
Six milestone years, with the figures as the model produces them: net monthly wage (after contributions, before tax), the era's menu price, the same price converted to a present-day classic gyro, and the index.
| Year | Wage (EUR) | Price (EUR) | Classic price (EUR) | Indexclassic gyros/month | Grade | Note |
|---|---|---|---|---|---|---|
| 1976 | 15.70 | 0.025 | 0.050 | 314 | D | Series start, regulated-price era |
| 1989 | 169.01 | 0.220 | 0.335 | 505 | B | Last year of the regulated era, documented price |
| 2002 | 485.19 | 1.240 | 1.230 | 394 | B | Euro adoption |
| 2011 | 728.74 | 2.000 | 1.750 | 416 | B | Before the minimum-wage cut |
| 2019 | 632.89 | 2.300 | 2.070 | 306 | A | Minimum wage restored |
| 2026 | 919.72 | 4.300 | 4.300 | 214 | B | Current reference year |
From 1989 (B) to 2025 (A), the index moves from 505 to 214, a change of -57.6%. At the top: 1989 (B) at 505 and 1985 (D) at 504, practically tied. At the bottom: 2025 (A) and 2026 (B, provisional), both at 214. Across the 56 robustness cases the peak falls in 1982 (D), 1984 (B), 1985 (D) or 1989 (B), depending on the assumptions, so the peak year is not a finding.
Price anchor. The series uses an anchor for this year. The entry may include rescaling or time weighting. It does not certify a national sample. Single source, rescaled to the reference basket: agoranomiki1989 EUR 0.22 -> EUR 0.22 (100%). Weighted mean EUR 0.22.
4. Data and sources
The series combines institutional wage and contribution data, historical price reports, modern surveys and gap-filling rules. Market reports, regulated ceilings, retrospective prices and estimates carry different evidential weight. A source entry alone does not certify primary verification or representativeness.
Source catalogue
- Arbitration award 10/1976 (Gazette B 671/20.5.1976) - statutory minimum wage · source
The series amount was verified in the original, effective from the start of July. A lower amount applies from 13 February. Paragraph 1(b), PDF page 2. This is a dated floor, not an annual mean.
- EGSSE 26.1.1977 (Gazette B 60/1.2.1977) - statutory minimum wage · source
The series amount applies from the start of July; the agreement provides an earlier increase from 15 February. Articles 1 and 10, PDF pages 2–3. It is not an annual mean.
- Arbitration award 9/1978 (Gazette B 183/3.3.1978) - statutory minimum wage · source
The series amount applies from the start of July, following an increase from the start of February. Paragraphs 1(b) and 8, PDF page 5. Annual earnings require a separate calculation.
- Arbitration award 6/1979 (Gazette B 194/24.2.1979) - statutory minimum wage · source
The series amount applies from 15 February. Article 1, PDF page 3. The former description as a weighted annual average was incorrect. The later award 100/1979 applies to the following year.
- Arbitration award 100/1979 (Gazette B 1137/27.12.1979) - statutory minimum wage · source
The series amount applies from the start of January under an instrument published the preceding December. Paragraphs 1(b) and 10, PDF pages 1–2. Publication year is not the year of application.
- Arbitration award 120/1980 (Gazette B 1303/24.12.1980) - statutory minimum wage · source
The instrument supplies a base and January/July increases for the following year, rather than printing the series amount itself. Paragraph 1, PDF page 2. Rounding and the later increase allowed by paragraph 3 remain under review.
- Arbitration award 1/1982 (Gazette B 115/19.3.1982) - statutory minimum wage · source
The series amount is the basic wage plus the corrective amount from the start of January. Article 3, PDF page 4. Article 8 provides for later indexation: January pay alone is insufficient for annual income.
- EGSSE 14.2.1984 (Gazette B 81/20.2.1984) - statutory minimum wage · source
Monthly floor from the start of the year for an employee aged at least 19 without seniority. Articles 1 and 9, PDF pages 5–6. May and September changes are provided for: the January level does not certify an annual mean.
- EGSSE 1985 (Gazette 50/B/31-1-1985) - statutory minimum wage · source
January salary for an employee aged at least 19 without seniority. Articles 1 and 10, PDF pages 4–5. May and September changes are provided for, so annual earnings require a separate calculation.
- EGSSE / arbitration awards 1976-1985 (primary Gazette texts, GSEE archive) · source
Statutory monthly floor for a white-collar employee over 19 with no seniority, read directly from the 1976-1985 agreements (e.g. 6,121 GRD in 1977, 31,932 GRD in 1985).
- Chania Prefecture price order 3/1977 (Haniotika Nea archive) · source
Regulated maximum price: pita gyro (doner) with a 37-40 g meat portion at 8.50 GRD. A regulated provincial price (Chania), not a free Athens market price.
- Makedonia daily, 24 Oct 1976, p. 9 - ministerial price order for gyros · source
Primary period report from the National Library newspaper archive. Sets the regulated price of a doner wrap at 7.50 GRD with pita, and records the market price before the order at 8 GRD, which measures the regulated-to-market factor directly.
- Rizospastis daily, 17 Jun 1978, p. 3 - price-control order on souvlaki · source
Primary period report from the National Library newspaper archive. Sets the doner wrap with pita at 10 GRD. The first documented wrap price inside the eleven years that had no source at all.
- Rizospastis daily, 9 Feb 1983, p. 9 - price-control order on souvlaki · source
The original scan, rechecked on 14 September 2026, refers to fresh-pork skewers of 37-40 g and a pricing rule linked to fresh pork. It supplies no sale price. Skewer requirements cannot verify gyro meat weights or a three-point gyro-portion trajectory. The article is verified; the full order and its product-specific scope still require checking.
- Rizospastis daily, 14 Aug 1983, p. 9 - a market price for the kebab-type souvlaki · source
The original newspaper was checked: 30 GRD, with a previous level of 28 GRD derived from the reported increase. The annual 28.75 GRD estimate is calculated, not a printed annual mean. The issue is dated 14 August 1983. It does not establish the price-change date. The 4.5 months at the new price remain an assumption. The paragraph names no city, shop or sample. It does not establish a national average price. The source describes a kebab-type souvlaki, without explicitly identifying pita, gyro or cooked-meat grams. Matching it to the series product remains an interpretation.
- Makedonia daily, 18 May 1979, p. 1 - two price-control orders on catering · source
The May rule states that souvlaki prices remain unchanged under that particular measure. It does not establish a full-year freeze. June and July 1979 sources report a later increase. The former zero interpolation weight is withdrawn.
- Rizospastis daily, 8 and 13 Jan 2002 - the paper's own survey of euro-changeover prices · source
A measurement contemporary with the event rather than a later recollection: “increases of up to 46%, from 350 drachmas to 1.5 euro”. The arithmetic checks out on its own, since EUR 1.50 is 511 GRD. Note the “up to”: 46% is the largest figure recorded, not the median, so EUR 1.50 serves as an upper bound for 2002 rather than a central value.
- Makedonia daily, 30 Dec 1979, p. 1 - “Souvlaki will go up too” · source
A prospective 13% pork-price rise, with the order still expected. It neither identifies the first rise of the year nor rules out the earlier gyro-in-pita increase. It supplies no annual price or proof of a full-year freeze.
- Louis Grivetti, “Changing gears”, travel expense ledger, Athens, 26 June 1984 · source
Grivetti's narrative and expense ledger agree on 35 GRD for one sandwich purchase. They describe the same purchase, not two independent observations. The series retains this single observation. The purchase date, 26 June 1984, was read in the published journal pages. Neither the book's 2015 publication nor the drachma/dollar ratio is used to date the purchase. The narrative places the purchase in Athens' Plaka/Monastiraki, without a shop name. A single central-Athens purchase is not a national sample. A bread sandwich is described, ordered without the usual onions and tomatoes. Pita, meat type, gyro and cooked weight are unspecified. Matching it to a gyro pita remains conditional.
- Let's Go, The Budget Guide to Greece, 1985 edition - souvlaki 30-35 GRD · source
Repository transcription: “souvlaki either skewered or wrapped in pita is a bargain at 30-35dr”. The 1985 edition does not establish previous-year prices. A fieldwork-date statement and the original page are needed. The passage combines skewers and wraps without separate prices or fillings. It remains comparison material awaiting verification, not an independently dated 1984 measurement.
- Travel-guide entries for Athens in 2000-2001 - wrap at 350-450 GRD · source
Repository transcriptions; original pages, observation dates and products await verification. Let's Go Greece 2000: “Gyros pita 400dr, souvlaki 250dr”. Lonely Planet Athens 2001: “Thanasis charges 350 dr for takeaway souvlaki wrapped in a small pitta” and “wrapped in pitta bread (450 dr) or pork gyros (400 dr)”. The French Lonely Planet: “Pitta Pan ... du gyros (425 dr) et du souvlaki (360 dr pour un simple)”. The model applies a geographical adjustment from central Athens; this is not a measured national median for that period. The pairs used for the skewer-to-wrap ratio need product and shop matching checks: 250/400 = 0.625 and 200/350 = 0.571.
- Tharros: Messinia Orders 15/1979, 5/1980 and 34/1980, annual gyro-in-pita calendar · source
Calculated annual ceiling from three original orders, not a printed annual mean. The audit page links each original and its legal commencement date. Continuity until the next recorded amendment and use as a national proxy remain assumptions. The existing regulation uplift remains modelled.
- Rizospastis, 28 Nov 1980, p.1 - “Souvlaki gets dearer” · source
The 29 November issue explicitly separates bread (12 to 14 GRD) from pita (15 to 17). The old pita anchor used the bread amounts and is replaced by the Messinia calendar. The original item remains accessible; it does not establish the serving format of its pork line or a skewer-to-wrap ratio.
- Rizospastis, 6 Jun 1981, p.1 - the souvlaki price is freed and put on a cost formula · source
NOT AN ANCHOR. Two contemporary newspapers dated 6 June 1981 corroborate the same government announcement: Rizospastis describes a complete mathematical formula, while Ipeirotikos Agon says the price would henceforth be based on the wholesale selling price. Both report a forecast rise of 2–3 GRD, not an observed or absolute price. The second paper closes the journalistic corroboration gap, not the legal chain. The order number and text, coefficients, exact product identity, geography, input prices and amendments through 1982 remain unknown. Market Order 14/1989 is a codification of the formula and does not establish when it was introduced. Without the underlying order, no yearly price, range or grade changes.
- Photographed Thessaloniki price lists 2006-2016 (tavernoxoros) - gyros wrap EUR 2.20 to 2.90 · source
Aristotelous menus in Thessaloniki for 2006–2010, 2012, 2016 were recovered and visually checked. Base pita prices agree with the legacy transcription. Dates come from host captions. This does not validate implied inflation or a national rate. Spread is charged separately; identical quantity and recipe remain unverified.
- Travel guides from the euro decade (2002-2011) - wrap at EUR 1.30 to 2.50 · source
Repository guide transcriptions awaiting verification against original pages and fieldwork dates, not a newly accepted anchor. The 2003–2010 series interpolates between 2002 and 2011 using implied gyro-inflation weights that also depend on 1998. Routard and Lonely Planet entries require exact editions, pages, product identification and checks for text reused across editions. The Savas entry attributed to the 2002 edition remains unverified. A lower shop price is not wrong because it disagrees with the series; comparing different shops does not establish an annual market decline. A historical tourism effect on this particular price has not been verified. The number of independent 2000–2001 guides remains unresolved. Earlier transcriptions and numerical claims are retained in the research record; production values and evidence grades are unchanged.
- Haniotika Nea (1976) - "The Chania market is the most expensive in Greece" · source
Contemporary report that Chania was among the most expensive markets in the country in 1976. Used as a representativeness check on the 1977 price order: 8.50 GRD is not a "cheap provincial" price, but it is a regulated ceiling, so the free market price is bracketed at 8.50-11 GRD.
- 1989 press report on price rises ("Soft drinks, patsas and souvlaki get dearer") · source
A 1989 newspaper report quoting: "Souvlaki with a burger patty served in a pita or a roll 70-80 GRD (from 65 GRD), that is at the same price as the skewer or gyro souvlaki." WHAT WAS ACTUALLY DEREGULATED: the report lists soft drinks, souvlaki WITH A BURGER PATTY, patsas and offal dishes. Gyro and skewer souvlaki were NOT on that list: they stayed regulated under the formula in article 201 of Order 14/1989 (see ad14_1989). They appear only as a level benchmark - the new free range of 70-80 GRD is stated to equal their price. The figure is therefore used as evidence of the market LEVEL for a 1989 wrap, not as proof that gyro was deregulated. Republished by reader.gr on 9 August 2026, seven days before Gyronomics first published, so it is not a circular source. The originating newspaper is not named.
- Market Order 14/1989, article 201 "Souvlakia" - compiled copy with amendments · source
Compiled text with later amendments, not an untouched scan of the original Gazette. Article 201 sets no fixed price but a FORMULA: "Souvlakia from gyro (doner)... weighing at least 37 g, cooked with a fat content up to 22%... The selling price is set from the purchase price per kilo of frozen beef... divided by factors of 10.4 and 12.2 for wholesale and retail respectively." Four things Gyronomics takes from it: (a) the 37 g MINIMUM WEIGHT is confirmed in national law and still in 1989, without establishing a measured average portion or retrospective national evidence for 1977; (b) §6, the wrapped price is the souvlaki price "increased by the purchase price of the pita raised by 50%", an explicit quantified relationship between wrap and bare skewer; (c) §11, a pita must weigh at least 65 g; (d) §12, the article applies "in the Prefecture of Attica and the city of Thessaloniki", and prefects elsewhere set prices "which may not be higher" - this is a ceiling rule allowing equality, not retrospective proof of a Chania–Athens difference in 1977 or a measurement of actual market-price differences. Note that article 201 stayed in force after 1989 (amended by Order 12/1992, Gazette B 314), so souvlaki price regulation did NOT end in 1989.
- ESYE - Monthly Statistical Bulletin (ELSTAT digital library) · source
Primary bulletins, table "Consumer price index". Two uses: (a) the "Hotels, cafes, restaurants" sub-index on the 1994=100 base (1995: 112.1, 1996: 123.4, 1997: 132.6), which extends the catering series behind Eurostat's coverage; (b) verification of the general CPI for 1988-1994 to the first decimal. Note that souvlaki is a named item of the CPI basket from 1988 (ESYE, Revised CPI 1988=100, sub-group "Snacks out", weight 4.4 per mille). In the bulletins examined, we did not locate a separate average-price series for a specified gyro in pita. Basket inclusion alone does not provide an absolute product price. This is a limit of our research, not proof that such records were never published.
- Consumer recollections (~2000) - skewer ~100-250 GRD · source
Recollections for 1999-2001 where the quoted 100-250 GRD "souvlaki" describes a bare skewer, not a wrapped pita gyro. No longer used as an anchor for the wrapped series; kept only as product-separation evidence.
- Wrapped pita gyro, late 1990s: model estimate · source
Model estimate, not a directly observed market price. See the year calculation for the current central value and range. Retrospective references with an unspecified product cannot be classified as skewers solely from their price. The euro-campaign date remains under review.
- Athens Magazine (2023) - "Souvlaki 250 drachmas" for 1999 · source
Retrospective article quoting a 250 GRD "souvlaki" in 1999, with no price bulletin reference and no wrapped/skewer distinction. Used as a lower sanity bound (skewer), not as a wrapped-gyro price.
- Euro "rounding up" in 2002 (Rizospastis 4-1-2002, NSSG/in.gr 2002) · source
Documents the mechanism behind the abrupt repricing of low-value items in early 2002: contemporary reports on rounding up, Ministry of Development fines in January 2002, and NSSG releases (inflation 3.7-4% with catering among the fastest-rising categories, August 2002). Explains why the increase clusters around 2002 rather than spreading evenly across five years.
- Patras, early 2000s - "when a pita gyro cost 1 euro" · source
Local recollection of a wrapped pita gyro at €1.00 in Patras shortly after the euro changeover. A regional lower bound consistent with a €1.17 average.
- Gyronomics visitor reports (crowdsourced) · source
Prices submitted by visitors per year and city. Shown as an independent comparison layer (yearly median); they do NOT affect the index calculation.
- Euro dual-pricing campaign (2001-2002) - pita gyro €1.17 · source
Reader’s retrospective report (30 August 2025) describes an illustrative campaign amount, not a market average. Reader dates the spot to 2002; OneMan to 2001. The original broadcast date is unverified. Assignment to 2001 remains a model assumption under review. The link leads to the repost, not an original campaign archive.
- EGSSE archive (Government Gazette / taxheaven.gr, ELINYAE) · source
National General Collective Labour Agreements: minimum wage floors for a single employee with no seniority increments.
- Derivation with wage indexation (ATA) / ELSTAT CPI (former method, not in the series) · source
A former method the series no longer uses: an estimate obtained by deflating the 1989 wage backwards using the official annual indexation increases. Since 27 September 2026 the wage for 1976–1993 is the mean of the monthly register (source "Monthly wage register").
- Monthly wage register 1976–1993 (Gyronomics, review of 27 September 2026) · source
The wage for each year 1976–1993 is the mean of the 12 months in the monthly register: the employee gross minimum and the employee contributions of each month, with bonuses and holiday pay as an annual-income convention. Every month carries an evidence grade: A when it rests on an original act or its explicit rule, B when it rests on an institutional retrospective source or a reconstruction from its percentages. The acts (national agreements, arbitration awards, ATA indexation) are sources of the months. Months, grades and sources are published in the payroll_evidence field of data.json. An index convention for an ordinary employee, not legal certification of an individual payslip.
- WSI Minimum Wage Database - Greece · source
Official series of the statutory monthly minimum wage (source: Ministry of Labour), 1994-2025.
- Ministry of Labour - press releases & minimum wage decisions · source
Ministerial Decision 8934/2026 (Gazette 1759/B/27-3-2026): minimum wage of €920 from 1 Apr 2026 (+4.55%).
- LiFO - “What a 1998 souvlaki would cost you today” · source
Retrospective article published on 8 Oct 2025: pita gyro in late-1990s Athens at 180-220 GRD, using 200 GRD as its 1998 example. It provides no contemporaneous menu, sample, method or underlying citation. Retained only as a sensitivity scenario, not a production anchor.
- newmoney.gr - “How our national street food went from EUR 2 to EUR 4-5” · source
Report of 11 Oct 2025 quoting the head of the Thessaloniki traders' federation and food critic G. Filippatos. Two usable data points: (a) “in the early 2010s the average price of a wrap hovered around EUR 2”, (b) October 2025: EUR 3.20-4.80 across the country, up to EUR 5 in some shops and EUR 5.50-9.90 in tourist hotspots (Mykonos). Tourist prices are excluded from the median.
- Pricefox - June 2022 nationwide wrap survey (reported by SKAI, Novasports, thetoc) · source
The June 2022 Pricefox survey: average wrap price EUR 2.50 in 2021 and EUR 3.50 in mid-2022, with an Athens neighbourhood map ranging from EUR 1.90 (Omonia, Ilion, Acharnes) to above EUR 3.70 (Melissia, Kolonaki, Glyfada, Nea Erythraia). It was republished on 15-16 June 2022 by SKAI, Novasports, thetoc, iefimerida and ERT with identical figures, so those outlets are the SAME source, not independent confirmations. Same firm as the December 2025 Pricefox edition: never treat the two as independent for one year. The 2022 figure is a mid-year reading, so it maps to the upper part of the annual average and enters as a range.
- Wrap prices across eight Attica areas (May 2025) · source
A report of 21 May 2025 giving counter prices: Dafni EUR 3.80, Neos Kosmos 3.90-4.00, Ilioupoli 4.20-4.40, Gyzi 3.70-3.90, Kolonaki 3.90-4.40, Kifisia 4.10-4.30, Vouliagmeni 4.00-4.20, Piraeus 3.70-3.90. The mean of the eight midpoints is EUR 4.01. Its value to the series is that these are COUNTER prices: our other 2025 sources are either delivery (Pricefox) or a single shop (Protagon). CAVEAT: the report states no methodology and no number of shops per area, so it enters with a reduced weight.
- Regional catering trade associations (April 2019) · source
A report of 24 Apr 2019 quoting the presidents and spokespeople of regional catering associations: Thessaloniki EUR 2.40-2.80, Patras 2.30-2.50, Chania 2.30-2.50, Kozani 2.70-2.80, Volos 2.80-3.00, Corfu 2.40-2.80. It is the fullest NATIONWIDE and CONTEMPORANEOUS picture we have for 2019, and notably from outside Athens, where all our other sources cluster. The mean of the six midpoints (EUR 2.61) is used. ATHENS IS DELIBERATELY EXCLUDED: the EUR 3.00 quoted for it was a price PROPOSED by the association, which is precisely why the Competition Commission opened an investigation into concerted practice - it is not an observed market price.
- Athina 9.84 (16 May 2019) - "The first price rises at souvlaki shops" · source
A CONTEMPORANEOUS May 2019 report (not retrospective) covering four Athens shops and quoting both the old and the new price: Kallithea 2.40 -> 2.60, Pagrati (pork gyro) 2.70 -> 3.00, Ampelokipoi 2.50 -> 2.80, Zografou 2.30 -> 2.70. It therefore yields an observation for 2018 (the "before" prices) and for 2019 (the "after" prices). SAMPLING CAVEAT: the piece is explicitly about shops that RAISED prices, so the sample is biased upward and enters with a reduced weight. Note also that the Pagrati shop quotes 3.00 EUR in May 2019 while the Protagon series places its own Pagrati shop at 2.00 EUR for 2019 - the two sources disagree on level.
- Newsbeast (15 Mar 2022) - shop-owner testimony, Keratsini/Neo Faliro · source
A contemporaneous trade account of the within-year path in 2022: a wrap at 2.50 EUR in early January, 2.80 EUR by March; skewer 1.60 -> 1.90 EUR. One shop in a working-class Piraeus area, below the Athens average, and a first-quarter reading in a year of 4.7% catering inflation (the series' annual mean of the CP11.1.1 restaurant CPI). It enters with a low weight and a wide 2.50-3.50 EUR range so it does not drag the annual mean down. The same article states plainly that before the euro "the wrapped souvlaki cost 250 drachmas".
- ANT1 (Aug 2026) - nationwide wrap prices by city · source
August 2026 survey with a year-on-year comparison: Athens 3.70-4.00 -> 3.80-5.00 EUR, Thessaloniki 4.20-4.80 -> up to 5.30 EUR, Crete 3.80-5.50 -> up to 6.50 EUR. The reported national average is 4.00-4.50 EUR. Its 2025 reading for Athens (3.70-4.00) agrees with our series. Because the measurement is taken mid-summer, 2026 enters as a SOFT anchor: it does not pin the year, it bounds it to 3.80-5.00 EUR.
- Gyronomics (Sept 2026) - our own reading of 1,660 shops across 78 cities · source
Harvested from the public listings of THREE ordering platforms (robots open on all three): 1,660 shops in 78 cities, of which 1,599 carry an explicit "pork gyros in pita", read on the same day. Median per shop EUR 4.20, and the median of the city medians also EUR 4.20. CHANNEL ADJUSTMENT: divided by 1.02, the measured platform-to-counter ratio (see PLATFORM_PREMIUM in observations.ts), giving EUR 4.12. WHAT IT IS AND IS NOT: a convenience sample, that is shops listed on a platform, which leans urban and newer. Athens is 38% of the sample against about 35% of the population and Thessaloniki 8% against about 10%, so the sample's geography resembles the population's without matching it. It therefore enters with a range of EUR 4.08-4.28, covering both ends of the channel factor.
- President of the Attica Grill Owners (2 May 2026) - average take-away and delivery prices · source
Nikos Angelosoulis, president of the Attica grill owners, gives enikonomia.gr dated Attica averages: pork/chicken pita take-away 3.70-4.20 EUR (3.50 EUR before 28 Feb 2026), by delivery 4.00-4.50 EUR (previously 3.70-4.30 EUR), and explicitly "the same cost applies to eating the pita in the shop". Skewer 2.50 EUR, up from 2.30 EUR. WHY IT COUNTS TWICE: it is the SECOND independent source for 2026 (every other August report reproduces the same ANT1 survey), and it is the only source giving THE SAME product in two channels on the same day, which measures the delivery premium without comparing across shops. The same article forecasts a 5-6% rise during May or June 2026, which is NOT used: it is a forecast, not a measurement.
- iefimerida.gr / ANA-MPA - “How much the wrapped souvlaki price rose since 2019” · source
Nationwide report with explicit historical reference points: “in 2015 the wrap cost EUR 2.20” and “in 2019 the wrapped souvlaki was about EUR 2”, with 2022 above EUR 3. The 2015 figure is repeated by cretaone.gr (23 Nov 2025). These are national counter prices rather than one shop, so they are used as LEVEL anchors for the 2010s.
- Protagon - “How the price of souvlaki doubled in five years” · source
Wrapped pita-gyro prices: 2019 ~€2.00, 2020 €2.50, 2021 €2.70, 2022 €3.20, 2023 €3.30, 2024 €3.80, 2025 €4.70.
- Pricefox - annual nationwide wrap price survey (6 cities) · source
An ANNUAL survey of real delivery prices for Athens, Thessaloniki, Patras, Larissa, Volos and Heraklion, per product (pork/chicken gyro, burger, skewer) with min, max and average. Two editions are used: 25 Oct 2024 (national average above EUR 3.60, nothing below EUR 2.80) and 4 Dec 2025 (city averages EUR 4.00-5.35, maximum EUR 6.50 in Crete). A HISTORICAL ERROR NOW FIXED: the October 2024 edition was recorded as "Dec 2025", so 2025 rested on 2024 data. Note that there is NO 2023 edition: the study listed under 2023 on the company's own index is the June 2022 one (see pricefox2022).
- Level correction: central Athens -> national median · source
The 2019-2025 Protagon series comes from a single shop in Pagrati, an above-average Athens neighbourhood. Visitor reports put Athens/Attica about 8% above the rest of Greece, matching local reporting (Thessaloniki 2022 at 3.90-4.00 EUR vs 4.30 EUR in Athens). A 1/1.08 factor rescales the level to a national median while leaving the rate of change untouched.
- Eleftherotypia 2001 (republished by reader.gr) · source
2001 price list: chicken pita gyro 530 GRD (€1.56). It refers to a central Athens shop and a premium chicken gyro, so it is used as an upper sanity bound, not as an average price.
- i-diakopes.gr / STAR report · source
Thessaloniki 2022: pita gyro €3.90-4.00.
- Derivation with official inflation (ELSTAT / Bank of Greece) · source
Where no documented price exists, the price is derived from the nearest documented price by applying the selected scenario's annual rate (general CPI, actual catering CPI, or implied gyro inflation).
- Eurostat HICP - "Restaurants, cafes and the like" (CP11.1.1), Greece · source
Official catering sub-index, annual average rates of change 1998-2025 (2026 is an estimate).
- Consumer recollections (1985) - REJECTED, superseded by documented anchors · source
Consumer recollections put a 1985 pita gyro at roughly 45-65 GRD. This is no longer used as an anchor: it is incompatible with the two documented market orders. A free-market price of 60 GRD in 1985 would imply the 1989 regulated ceiling of 65 GRD was only 8.3% higher after four years in which the general CPI rose 84.8%. The 1977 Chania order carried forward on the general CPI alone predicts the 1989 ceiling to within 3.4%, so 1985 is now interpolated instead. Kept here to document why it was rejected, and because of circular-source risk: articles repeating Gyronomics' own estimate are not independent confirmation.
5. Calculation methodology
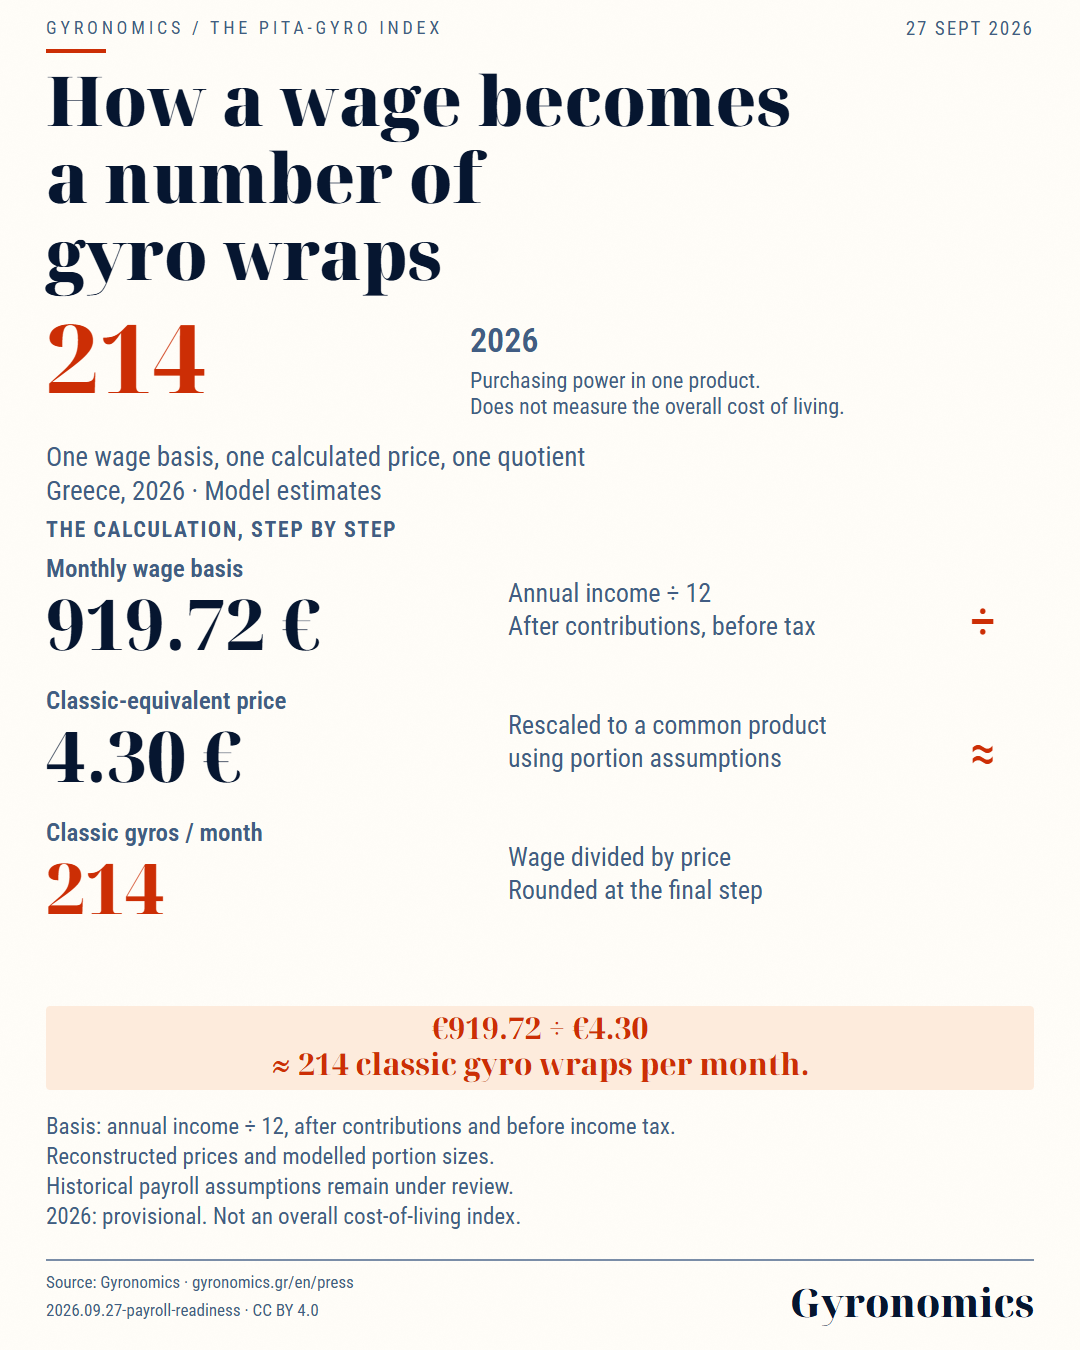
How is the index calculated?
2026: annual income ÷ 12 = €919.72 per month. Dividing by the calculated classic price of €4.30 gives about 214 classic-equivalent gyros.
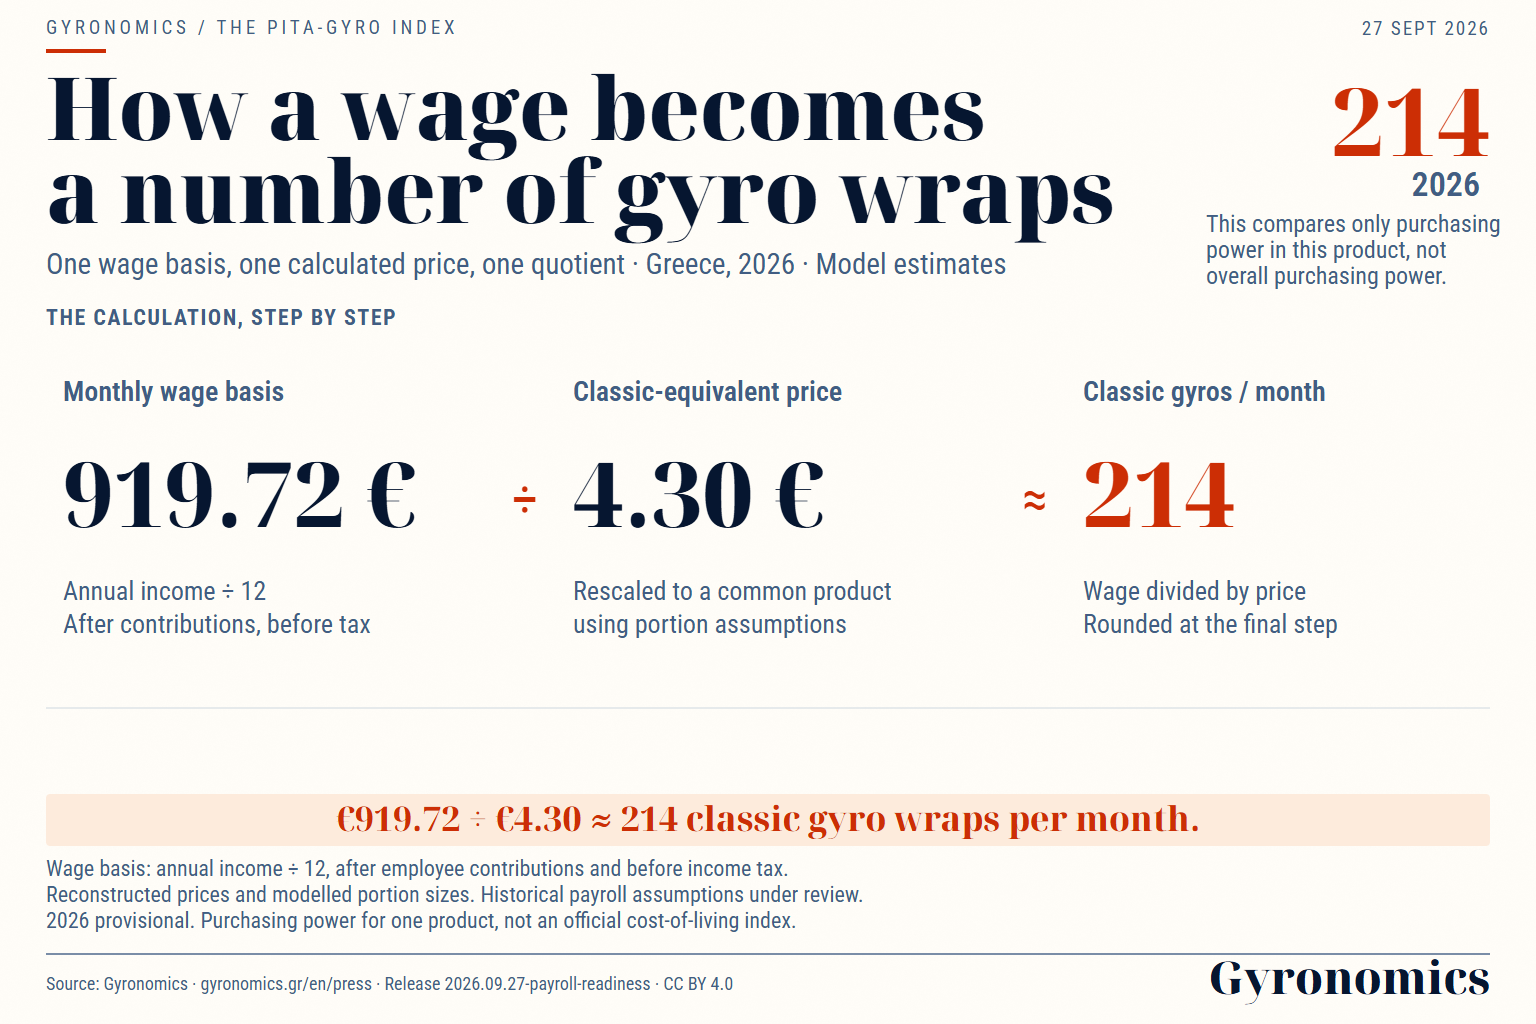
SVG, source and notes
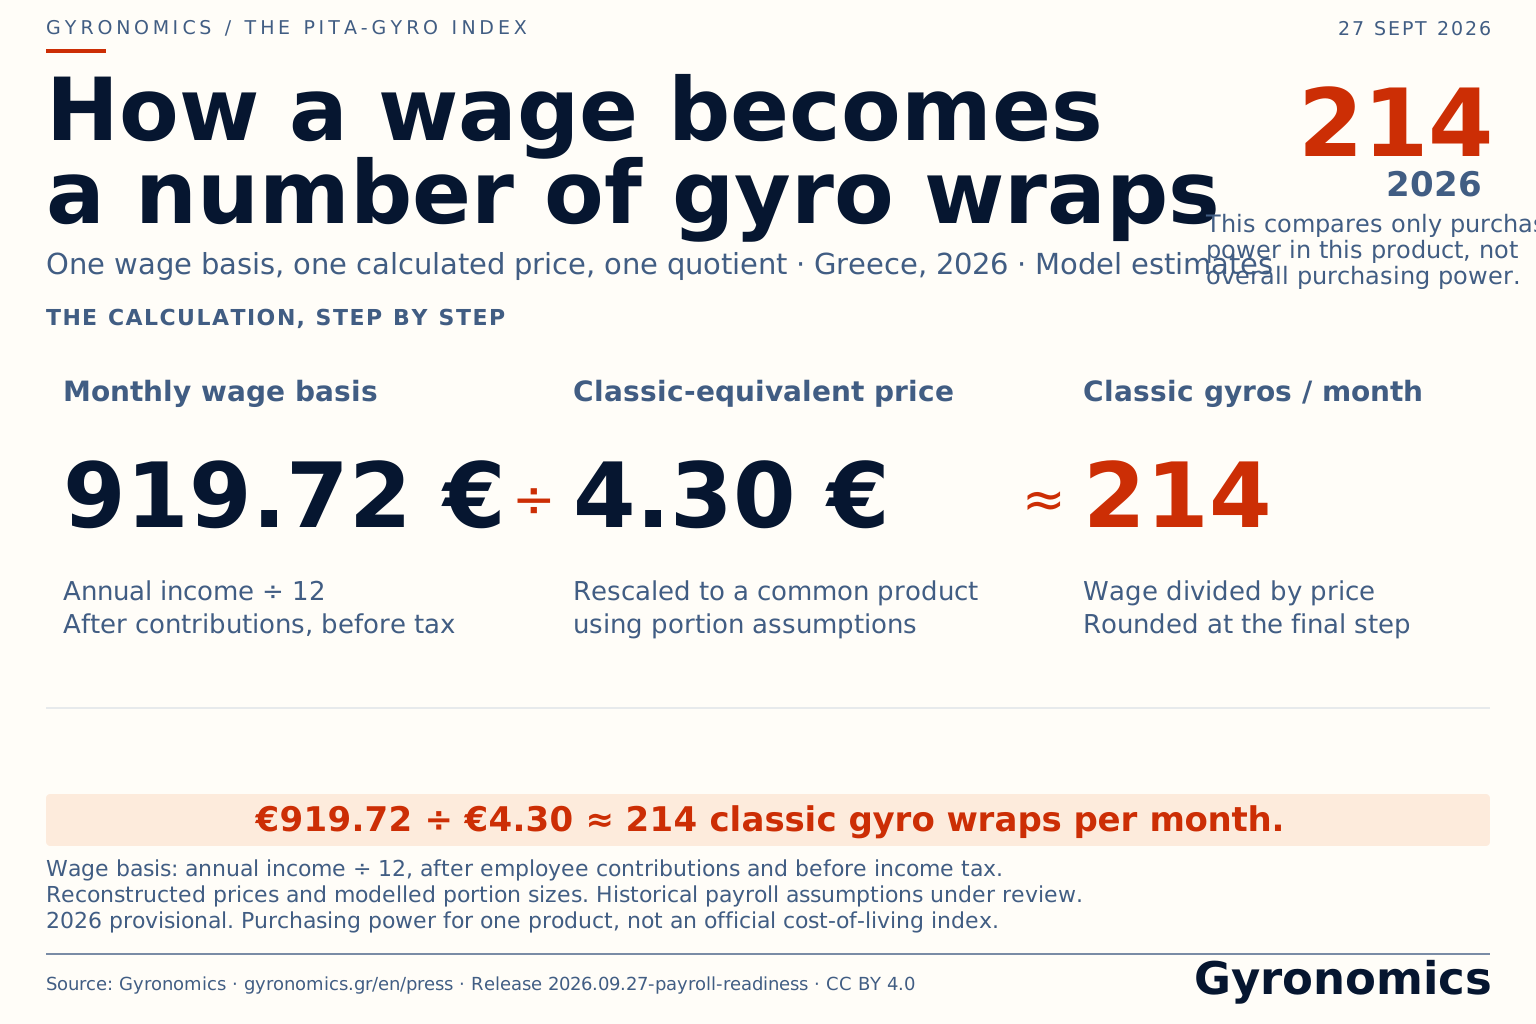
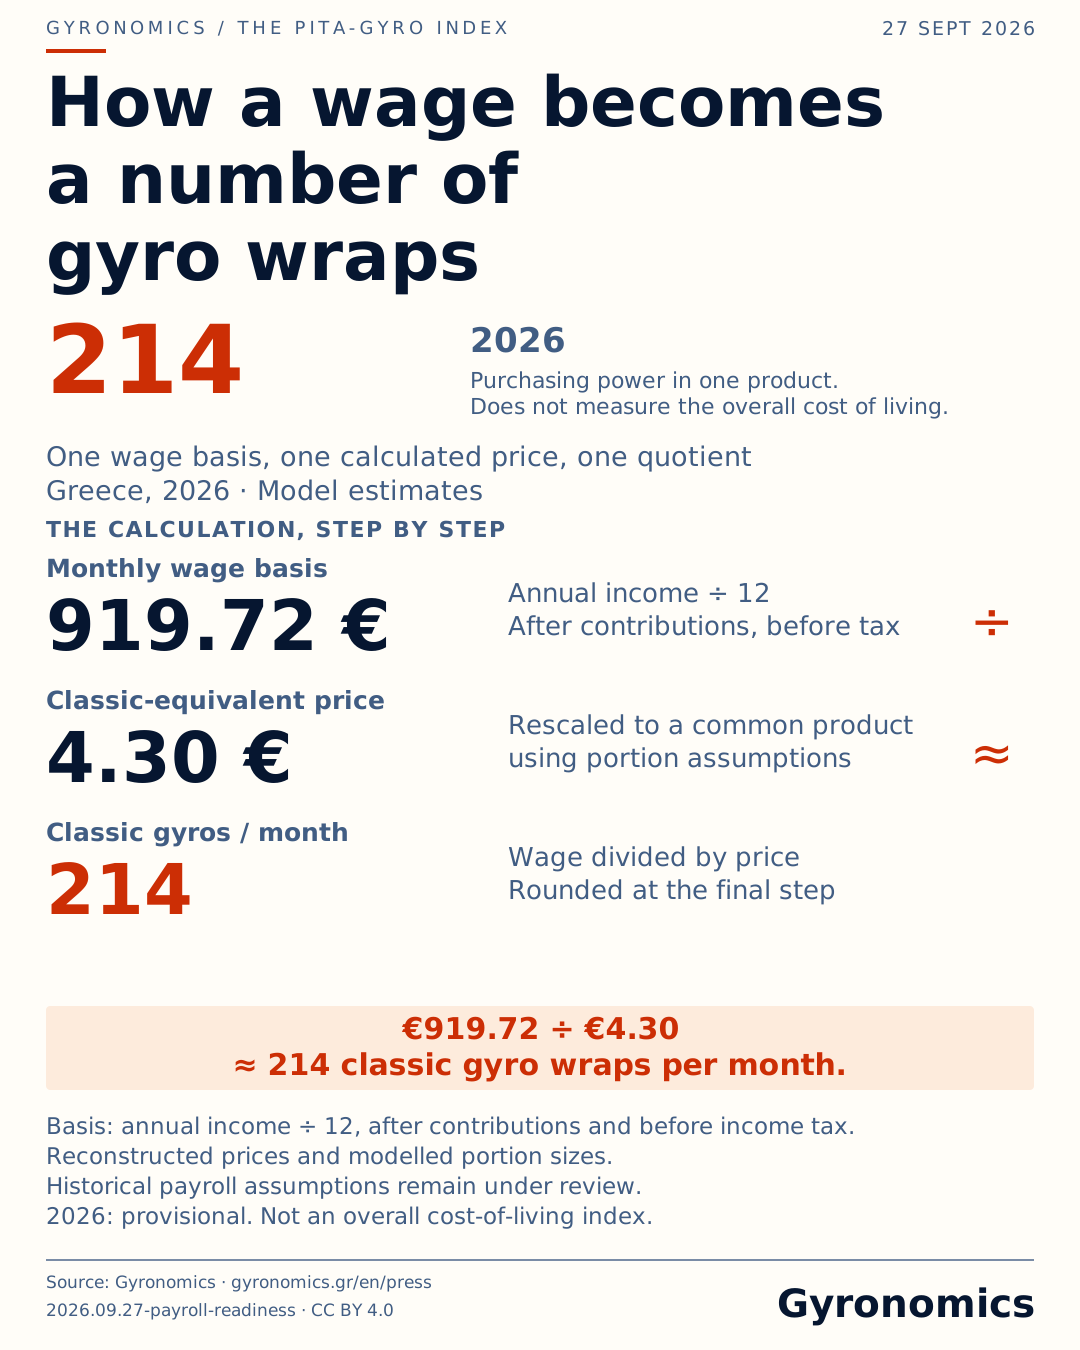
- Wage basis: annual income ÷ 12, after employee contributions and before income tax.
- Reconstructed prices and modelled portions. Historical payroll assumptions remain under review.
- 2026: provisional. A one-product indicator, not the overall cost of living.
Release: 2026.09.27-payroll-readiness · CC BY 4.0
Immutable image datasetThe calculation has two independent inputs: wage and period price. Classic conversion is applied to the price after constructing the historical series. The walkthrough below reads the exact row used by the index.
Income tax is NOT deducted here. The after-tax variant is calculated separately for years with documented tax schedules.
Wage payments
14
Payments used by the model for this year.
Reference wage
15.7 €
Annual income divided by twelve, after contributions and before tax. Calculated before rounding the contractual payment.
Period price
0.025 €
Backcast
Model composition
38 g · 0%
Grams and fries share in the model. This is not a measured percentage of shops.
Equivalence and factor
0.497 · ×2.012
Each stage rounded to 3 decimals.
Classic price and index
0.05 € → 314
15.7 ÷ 0.05 = 314 → 314
Calculated backwards from a later anchor using CPI. The separate source entry for this year is retained, but is not used to calculate the series price.
Series source: Derivation with official inflation (ELSTAT / Bank of Greece)
Sources and limitations for 1976In the baseline, anchors and special rules constrain the series. In the alternative headline and pure catering CPI paths, free compounding after the base is unconstrained by later prices. This asks a different counterfactual question; it does not independently validate the baseline.
5.1 The crisis decade 2012-2019
Asymmetric pass-through is a selected model rule for this period. It does not establish that no shop reduced its price. VAT changes are not added separately to catering CPI. In soft-anchor years, the source is blended with the calculated path.
blended = softAnchor ? (next + anchorInput) / 2 : next
clamped = softAnchor ? min(max(blended, softMin), softMax) : blended
floor = year > 2012 ? max(clamped, min(previous, softMax ?? Infinity)) : clamped
price = round(floor / 0.05) × 0.05
| Year | Pricemenu price, of the era | Indexclassic gyros/month | Rule | Reference |
|---|---|---|---|---|
| 2012 | 2.050 € | 336 | Asymmetric CPI pass-through | Model rule: carry forward non-negative catering CPI from the previous year and round to menu-price steps. This is not a new price observation. Derivation with official inflation (ELSTAT / Bank of Greece) |
| 2013 | 2.050 € | 323 | Asymmetric CPI pass-through | Model rule: carry forward non-negative catering CPI from the previous year and round to menu-price steps. This is not a new price observation. Derivation with official inflation (ELSTAT / Bank of Greece) |
| 2014 | 2.050 € | 327 | Asymmetric CPI pass-through | Model rule: carry forward non-negative catering CPI from the previous year and round to menu-price steps. This is not a new price observation. Derivation with official inflation (ELSTAT / Bank of Greece) |
| 2015 | 2.150 € | 316 | Soft anchor | The price blends the CPI path with the anchor input, is constrained by its range and is rounded to menu-price steps. The input does not directly replace the final price. Single source, rescaled to the reference basket: iefimerida EUR 2.20 -> EUR 2.20 (100%). Weighted mean EUR 2.20.iefimerida.gr / ANA-MPA - “How much the wrapped souvlaki price rose since 2019” |
| 2016 | 2.200 € | 303 | Asymmetric CPI pass-through | Model rule: carry forward non-negative catering CPI from the previous year and round to menu-price steps. This is not a new price observation. Derivation with official inflation (ELSTAT / Bank of Greece) |
| 2017 | 2.250 € | 292 | Asymmetric CPI pass-through | Model rule: carry forward non-negative catering CPI from the previous year and round to menu-price steps. This is not a new price observation. Derivation with official inflation (ELSTAT / Bank of Greece) |
| 2018 | 2.250 € | 288 | Asymmetric CPI pass-through | Model rule: carry forward non-negative catering CPI from the previous year and round to menu-price steps. This is not a new price observation. Derivation with official inflation (ELSTAT / Bank of Greece) |
| 2019 | 2.300 € | 306 | Soft anchor | The price blends the CPI path with the anchor input, is constrained by its range and is rounded to menu-price steps. The input does not directly replace the final price. 3 sources, rescaled to the reference basket: athina984 EUR 2.75 -> EUR 2.55 (26%) · regions2019 EUR 2.61 -> EUR 2.61 (39%) · iefimerida EUR 2.00 -> EUR 2.00 (35%). Weighted mean EUR 2.36.Regional catering trade associations (April 2019) |
6. Classic-equivalent conversion
Equivalence = 0.7 × min(grams / 88, 1.35) + 0.3 × (0.65 + 0.35 × fries share). Equivalence, its reciprocal factor and the classic price are successively rounded to 3 decimals. The wage is divided by that price and the quotient rounded to an integer. Historical meat weights and changes in composition are model assumptions, not a series of market measurements. The assumed peak and decline in portion size need verification. The present-day weight defines the reference product. The era price refers to the wrap sold at the time; the classic price and weight-adjusted index depend on these assumptions.
E = R(compositionEquivalence)
F = R(1 / E)
Pclassic = R(Pperiod × F)
Iclassic = round(Wannualised / Pclassic)
For 1976, equivalence is 0.497 and the published factor is 2.012. In the last year, equivalence is 1.000. The factor is a rounded reciprocal, so its product with equivalence approximates unity rather than necessarily equalling it exactly.
Parameters: definition, evidence and limitations
- Reference portion: 88 g
- Product definition. Defines the classic-conversion unit. It is not a measured national mean portion.
- Meat share / remaining composition / cap: 0.7 / 0.65 / 1.35
- Model assumptions. Value weights and a bound on the meat component. No independent costing table calibrates these values through time.
- Grams and fries inclusion: Annual curve
- Historical assumptions. Historical meat weights and changes in composition are model assumptions, not a series of market measurements. The assumed peak and decline in portion size need verification. The present-day weight defines the reference product. The era price refers to the wrap sold at the time; the classic price and weight-adjusted index depend on these assumptions.
- Athens through 2022: ÷ 1.08
- Level adjustment. Linear transition to unity by 2025. Historical transfer and the effect on growth rates require separate assessment.
- Delivery / platform: ÷ 1.076 / ÷ 1.02
- Channel factors. Adjustments with limited calibration. A ratio of midpoints of reported ranges is not a matched-shop measurement; historical application is an assumption.
- Mixed basket: × 1.1
- Rescaling assumption. Rescaling to pork gyro without reproducible product-level calibration.
- Regulated ceilings: × 1.11
- Reported price ratios. Factor from 2 recorded ceiling/market comparisons with differing timing or product. Generalisation across the period remains an assumption. It is not applied to every market price merely because of its date.
- Drachma to euro: ÷ 340.75
- Fixed unit conversion. Converts currency units. It does not inflation-adjust historical amounts.
The historical-product scenario with fries uplift 12% and portion uplift 10% uses a different product base. Its coefficients are not added to the classic index above.
What changes without intermediate rounding?
Holding published period prices, wages and composition assumptions fixed, 14 of 51 years change. The largest difference is 2 classic gyros (0.64%).
The peak remains in 1989 (505 → 504) and the trough in 2025, 2026 (214 → 214). Exporting the new price at the existing precision would make wage divided by price reproduce a different new index in 11 years.
We retain the published rounding chain. The alternative removes numerical noise but adds no historical accuracy. Adopting it requires a simultaneous change to exported price precision and recalculation of all scenarios. It is not a display change. The comparison remains available for inspection.
The file covers every year and all three CPI modes, using annualised and contractual wages. Hypothetical indices do not replace the series.
7. Sensitivity analysis
Joint wage, price and composition analysis: calculates which peaks and completed-year comparisons change within the selected specifications. Case counts do not express probabilities, and payroll assumptions retain their review status.
Excluding the 1983 and 1984 prices: a separate analysis of both measures, with dependent years recalculated and CSV/JSON exports. Wages and portions stay fixed, so its findings do not extend to different wage bases or product models.
The table tests two specific changes: a small meat-share adjustment and a different CPI path. It does not cover every assumption about size, composition, geography or source selection.
| Assumption | Variant | Index 1976 | Index 2026 | 1976 delta |
|---|---|---|---|---|
| Baseline | meat share 70% | 314 | 214 | - |
| Meat cost share | 65% (-5 pp) | 320 | 214 | +2% |
| Meat cost share | 75% (+5 pp) | 308 | 214 | -2% |
| CPI scenario | headline CPI | 314 | 609 | 0% |
| CPI scenario | pure catering CPI | 314 | 467 | 0% |
The uneven steps arise from rounding: the classic-equivalent price for 1976 is EUR 0.050, rounded to three decimals as everywhere in the series. At that magnitude one thousandth is 2.0% of the price, so the index moves in coarse, uneven steps. Every row of the table, the baseline included, goes through the same rounding chain as the published index.
With a ±5 percentage-point change in meat share, the maximum change for 1976 is 2.0%. This concerns this small adjustment and this year. It does not validate the whole composition conversion.
Across the 7 published composition tests, peak years are 1982, 1985, 1989 and peak levels range from 435 to 763 classic gyros. Periods with the largest annual decline are 2011–2012. These are selected assumption tests, without probabilities or a statistical confidence interval.
8. Confidence and uncertainty
Categories describe how the price enters the model. They do not certify original-source verification, representative sampling or historical product composition.
Price ranges use a recorded source range where applicable, or a selected percentage band in the model. They are not statistical confidence intervals. Dividing the wage by the bounds gives a period-index range at a fixed wage. It does not propagate wage, composition or geographic-adjustment uncertainty.
- Grade A - model price anchor: 7 years (2000, 2001, 2019, 2021, 2022, 2024, 2025)
- Grade B - regulated, single-source or estimate: 13 years
- Grade C - interpolated: 23 years
- Grade D - interpolated inside the price-control era, or a projection: 8 years (1976, 1979, 1981, 1982, 1985, 1986, 1987, 1988)
9. Community reports
Visitors submit a price, a year and optionally a city. Reports appear as an independent comparison layer (median per year) and do NOT affect the official calculation, avoiding circularity. Where a city is given, they are grouped into 3 regions: Athens / Attica, Thessaloniki, Rest of Greece.
The form does NOT ask for the channel, that is whether the price is over the counter or for delivery. Reports therefore cannot measure the delivery uplift: that comes from other sources (see DELIVERY_PREMIUM). Nor do they separate the islands, which fall under "Rest of Greece".
10. Validation
The model passes automated consistency checks: unit guard (GRD/EUR), quotient recomputation, a diff report against previous versions and per-row rounding notes in the table. All intermediate steps are public on the Calculations page.
These checks establish calculation and presentation consistency. Empirical validation requires independent, comparable observations not used to choose anchors or coefficients. Hypothetical scenarios do not replace that process.
11. Reproducibility and open data
Download an exact dataset state and reproduce the calculation
Public JSON and CSV files allow reproduction of published ratios and year comparisons without an access key. Recalculation from primary sources also requires the code's rules and inputs, together with evidence checks.
- /api/public/data.json- Full 1976-2026 series as JSON
- /api/public/data.csv- Same data as CSV
- /api/public/sources.json- Sources and citations per year
- /api/public/versions.json- Version history of the index
- /api/public/audit-log.json- Detailed audit log of changes
Use annualised wage salary_annualized_eur and the already calculated classic price price_classic_eur, at the file's full precision. salary_payments identifies each year's payments. salary_contract_eur is one contractual payment, before annualisation. Reconstructing the classic price from the period price requires every rounding step in section 6.
12. Relation to other indices
The Gyro Index belongs to the single-item index family, like The Economist's Big Mac Index. The difference is that this index relates wages to prices within one country, and that the product is explicitly standardised by composition instead of being assumed constant.
- Versus headline CPI: official inflation covers a basket of hundreds of items with shifting weights. A single-item index loses representativeness but gains transparency - you see exactly what is measured.
- Versus catering CPI (Eurostat CP11.1.1): we use CP11.1.1 only to interpolate between anchors, never as the result. Documented prices pin the series and CPI fills the gaps.
- Versus hours-of-work measures: the calculator page also gives that reading (how much work time one gyro costs), which is more robust to changes in working hours.
13. Limitations
- Price anchors before 2002 are sparse and often local - the reference series includes geographic-adjustment assumptions.
- The regulated era 1976-1989 includes reports of market prices too. The ×1.11 factor is calculated from a small number of price pairs. Extending it to other years is an assumption requiring independent assessment.
- The classic conversion relies on an estimated meat cost share (70%) - sensitivity: ±5 pp shifts the 1976 index by at most 2.0%.
- The index tracks the minimum/base wage - it does not capture the median wage.
14. Versioning, citation and licence
Every change to data or methodology is recorded in the public changelog. This whitepaper is updated alongside it: the parameters cited here are interpolated from the code rather than copied, so the document does not lag behind the model.
This is not a promise of good intentions: automated tests hold it. A scanner fires when a computed figure is typed as a constant inside reader-facing text, and the consistency page compares every amount and every index across the series, the table, the texts, the FAQ and the exports. Wherever something has slipped in the past, a test went in and the reason was written down.
Data and text are free to use with attribution (CC BY 4.0). If you cite a number, pin it to the version you read - values are revised when new sources appear.
How to cite the index
The data is published under CC BY 4.0: use it freely, crediting the source, version and SHA-256. These citations and downloads point to the same immutable archive of the baseline dataset.
The archive includes the baseline catering-CPI series, period gyros and classic gyros. It does not include hypothetical choices in the live view or your personal calculation. The daily version alone does not identify the exact same files.
Gyronomics, "Pita-Gyro Index 1976-2026: baseline dataset", version 2026.10.10-monthly-bulletin (2026-10-10). Archive SHA-256 (manifest): 111be5b6d29bb2823d1c85a12489f0b4382c869e4d01e3c33fd1b0c69dbd3d14. Available at https://gyronomics.gr/datasets/111be5b6d29bb2823d1c85a12489f0b4382c869e4d01e3c33fd1b0c69dbd3d14/bundle.json