Gyronomics
Gyronomics measures the minimum wage's purchasing power in classic pita gyros. Explore its history, compare years and check the sources.
Data last updated:
To buy as many pita gyros as in 1985
2,167 €
you would need per month
instead of
919.72 €
the 2026 net minimum wage per month, after contributions, with the bonuses spread over 12 months
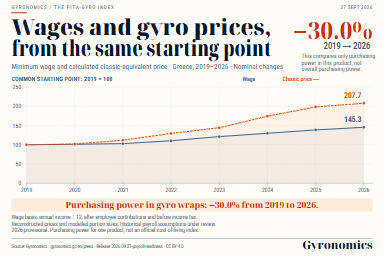
Today's wage covers 42%: it would have to be 2.4 times larger. To buy as much as in 2019, only 7 years ago, you need 1,316 €.
It measures one product, not the cost of living: it is not a living-wage estimate and excludes rent, power and the grocery basket. It is the same index read backwards, 504 classic pita gyros times the 2026 price. Change the year · What it does not say
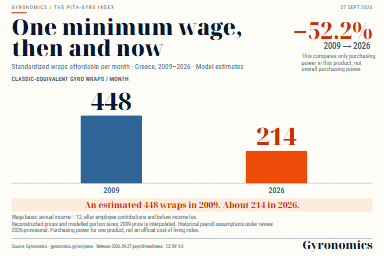
2026: 214 classic pita gyros per month, approximately.
Wage after contributions and before income tax, using annual income divided by 12. A one-product indicator, not the overall cost of living.
The Gyronomics bookOne wage, how many gyros?The short edition in 32 pages, with charts and sources. The full edition is also available.Choose an edition and read →What the wage bought, then and now
The base series compares purchasing power in classic pita gyros. Each year leads to its price, calculation and sources.
Dashed segments indicate interpolation between price inputs. Other prices include sources, adjustments and estimates; conversion to the classic product uses assumptions.
Gyronomics in pictures
All graphics and downloads →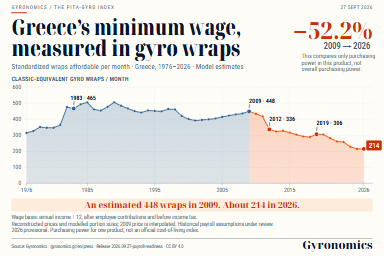
What if the wage bought as much as before?
Keep another year's gyro count fixed and find the wage needed to buy it today.
The answer
For the minimum wage to buy as many wraps as it did in 2011, it would have to be 1,789 € a month before income tax today. It is 919.72 € - 51.4% coverage.
TargetB
416
classic wraps per month - as in 2011
Required wage 2026
1,789 €
monthly before income tax, 14-payment basis
Actual wage 2026 (14 payments)
919.72 €
-869 € (51.4% coverage)
Milestones of economic and historical change. Price provenance and assumptions differ by year.
The 2011 wage bought 416 classic wraps per month. Absolute era index: 364.
When filled, the reference year is ignored.
On the 14-payment basis the 2026 wage is 919.72 € (11,037 € annually / 12) because it includes bonuses and holiday pay. On the contract basis it is 788.33 €, after contributions and before income tax. Coverage is identical in both.
The file is read on your device. We verify it and show a preview before changing your selections. Required archived data may need a connection.
These files include your personal selections. They are saved on your device and are not automatically sent to anyone.
After contributions, before income tax. Annual income divided by 12, using 14 payments throughout the series. Wage and contributions are twelve-month means. Purchasing power in classic gyros.
Required wage = wrap target x classic-equivalent wrap price of that year. For 2011 coverage is 100% by construction, since the reference year sets the target. All values are in euros (drachmas converted at the fixed rate). The wage is the statutory minimum after contributions and before income tax. The 14-payment basis converts the model wage to an annual equivalent divided by 12. Historical payment counts and deductions are under review; this is not a verified payroll calendar.
Required vs actual wage
Loading chart…
Where the blue line sits below the orange one, the actual wage falls short of the target.
Year by year (51 years)
| Year | Classic price (absolute) | Required | Actual (14 payments) | Coverage |
|---|---|---|---|---|
| 1976 | 0.05 €(0.03 €) | 21 € | 15.70 € | 75.5% |
| 1977 | 0.06 €(0.03 €) | 23 € | 18.18 € | 78% |
| 1978 | 0.06 €(0.03 €) | 27 € | 22.44 € | 84.3% |
| 1979 | 0.08 €(0.04 €) | 31 € | 25.93 € | 83.1% |
| 1980 | 0.09 €(0.05 €) | 38 € | 31.47 € | 83.1% |
| 1981 | 0.11 €(0.06 €) | 45 € | 39.17 € | 87.2% |
| 1982 | 0.13 €(0.07 €) | 53 € | 60.28 € | 114.1% |
| 1983 | 0.15 €(0.08 €) | 61 € | 67.96 € | 111.9% |
| 1984 | 0.17 €(0.10 €) | 72 € | 85.52 € | 118.1% |
| 1985 | 0.20 €(0.12 €) | 83 € | 100.88 € | 121.2% |
| 1986 | 0.24 €(0.15 €) | 101 € | 111.52 € | 110.8% |
| 1987 | 0.27 €(0.17 €) | 113 € | 123.11 € | 108.8% |
| 1988 | 0.30 €(0.19 €) | 124 € | 142.36 € | 114.5% |
| 1989 | 0.34 €(0.22 €) | 139 € | 169.01 € | 121.3% |
| 1990 | 0.41 €(0.28 €) | 170 € | 197.65 € | 116.2% |
| 1991 | 0.48 €(0.34 €) | 200 € | 224.34 € | 112.1% |
| 1992 | 0.55 €(0.41 €) | 231 € | 249.04 € | 108.1% |
| 1993 | 0.62 €(0.48 €) | 258 € | 273.55 € | 105.9% |
| 1994 | 0.68 €(0.54 €) | 283 € | 308.09 € | 109.1% |
| 1995 | 0.75 €(0.62 €) | 311 € | 336.54 € | 108.3% |
| 1996 | 0.81 €(0.69 €) | 338 € | 363.52 € | 107.6% |
| 1997 | 0.85 €(0.75 €) | 353 € | 391.98 € | 111.1% |
| 1998 | 0.90 €(0.82 €) | 374 € | 413.07 € | 110.6% |
| 1999 | 1.02 €(0.97 €) | 425 € | 427.79 € | 100.7% |
| 2000 | 1.11 €(1.09 €) | 463 € | 445.94 € | 96.2% |
| 2001 | 1.18 €(1.17 €) | 491 € | 460.66 € | 93.9% |
| 2002 | 1.23 €(1.24 €) | 512 € | 485.19 € | 94.8% |
| 2003 | 1.28 €(1.31 €) | 533 € | 509.60 € | 95.7% |
| 2004 | 1.33 €(1.38 €) | 552 € | 535.73 € | 97% |
| 2005 | 1.37 €(1.45 €) | 571 € | 567.09 € | 99.3% |
| 2006 | 1.43 €(1.53 €) | 594 € | 601.72 € | 101.4% |
| 2007 | 1.48 €(1.61 €) | 616 € | 634.39 € | 103% |
| 2008 | 1.55 €(1.71 €) | 645 € | 673.91 € | 104.4% |
| 2009 | 1.59 €(1.78 €) | 662 € | 712.17 € | 107.6% |
| 2010 | 1.67 €(1.90 €) | 696 € | 724.77 € | 104.1% |
| 2011 | 1.75 €(2.00 €) | 728 € | 728.74 € | 100.1% |
| 2012 | 1.78 €(2.05 €) | 741 € | 597.78 € | 80.7% |
| 2013 | 1.77 €(2.05 €) | 736 € | 570.94 € | 77.6% |
| 2014 | 1.76 €(2.05 €) | 731 € | 574.36 € | 78.6% |
| 2015 | 1.83 €(2.15 €) | 761 € | 577.78 € | 75.9% |
| 2016 | 1.90 €(2.20 €) | 790 € | 575.78 € | 72.9% |
| 2017 | 1.97 €(2.25 €) | 819 € | 574.36 € | 70.1% |
| 2018 | 2.00 €(2.25 €) | 830 € | 574.36 € | 69.2% |
| 2019 | 2.07 €(2.30 €) | 861 € | 632.89 € | 73.5% |
| 2020 | 2.11 €(2.31 €) | 877 € | 640.75 € | 73% |
| 2021 | 2.32 €(2.50 €) | 963 € | 651.26 € | 67.6% |
| 2022 | 2.68 €(2.85 €) | 1,115 € | 698.89 € | 62.7% |
| 2023 | 2.99 €(3.13 €) | 1,242 € | 766.95 € | 61.7% |
| 2024 | 3.61 €(3.72 €) | 1,500 € | 821.46 € | 54.8% |
| 2025 | 4.10 €(4.17 €) | 1,707 € | 876.77 € | 51.4% |
| 2026 | 4.30 € | 1,789 € | 919.72 € | 51.4% |
Three purchasing-power stories
What wage you would need today to buy as many gyros as back then, measured in gyros. All three years carry a documented gyro price - the letter next to the year says how solid.
After contributions, before income tax. Annual income divided by 12, using 14 payments throughout the series. Wage and contributions are twelve-month means. Purchasing power in classic gyros.
Gyros like it's 1989B
The 1989 minimum wage bought 505 classic wraps a month.
Absolute index (wrap of that era): 768 a month.
2,172 €
required wage before income tax in 2026
At the 2026 price (4.30 €) you would need 2,172 € a month before income tax for the same purchasing power in gyros. Today's minimum is 919.72 €, i.e. short by 1,252 €.
Documented price from price-control order 14/1989.
Gyros like it's 2002B
The 2002 minimum wage bought 394 classic wraps a month.
Absolute index (wrap of that era): 391 a month.
1,694 €
required wage before income tax in 2026
At the 2026 price (4.30 €) you would need 1,694 € a month before income tax for the same purchasing power in gyros. Today's minimum is 919.72 €, i.e. short by 774 €.
The year the gyro moved from the drachma to the euro.
Gyros like it's 2019A
The 2019 minimum wage bought 306 classic wraps a month.
Absolute index (wrap of that era): 275 a month.
1,316 €
required wage before income tax in 2026
At the 2026 price (4.30 €) you would need 1,316 € a month before income tax for the same purchasing power in gyros. Today's minimum is 919.72 €, i.e. short by 396 €.
The best-documented year before the pandemic.
What if you earned the minimum wage of the year you were born?
Pick your birth year and see how many present-day classic wraps the minimum wage bought then, and what wage you would need today for the same result. We also show the absolute index, the wrap as it was back then.
After contributions, before income tax. Annual income divided by 12, using 14 payments throughout the series. Wage and contributions are twelve-month means. Purchasing power in classic gyros.
How it is calculated
1. Take that year's index
Divide the minimum wage after contributions and before income tax, on an annual-income-divided-by-12 basis, by the classic-equivalent gyro price. Round the index to an integer.
2. Keep the index fixed
That number of classic gyros per month becomes the purchasing-power target for every other year.
3. Multiply by the current price
Multiply the target by the classic gyro price of the year examined. The result is the required wage after contributions and before income tax, on an annual-income-divided-by-12 basis.
All amounts are after contributions and before income tax, on an annual-income-divided-by-12 basis, drachmas are converted at the fixed 340.75 GRD/EUR rate, and gyro prices come from documented anchors with interpolation for the years in between.
Detailed methodology
- Required wage(year) = classic gyro target x classic-equivalent gyro price(year). Prices come from the dashboard's main series (documented anchors and implied derivation).
- The actual wage is the net statutory minimum monthly wage for a single employee, after employee contributions and before income tax.
- Coverage = actual / required wage. Below 100% the wage is not enough for the target.
- Amounts use the series annualisation: wage per payment × 14 payments ÷ 12. The twelve-month mean and selected contributions cover the full series; lower-grade early evidence cells remain separately identified. This card has no basis switch; the wage calculator shows a single payment.
- Pre-2002 values are expressed in euros at the fixed 340.75 GRD/EUR rate, for comparability only.
Explore Gyronomics
The data, the sources and the rest of the tools.
- In 5 stepsNew here? Five short steps explain how we measure wages in gyros.
- Pita-Gyro Index 1976-2026Purchasing power through time, with a chart, comparisons and the origin of every figure.
- Salary calculatorEnter your own wage and see how many gyros it buys, how much work time one gyro costs, and how that compares to the past.
- Gyro DayThe date each year when the wage covers one gyro a day for the whole year, plus a 2030 outlook.
- The classic gyro wrapWhen fries moved inside the pita, how the meat portion changed, and why we are not always comparing the same product.
- Data & checksThe full 1976-2026 table, CSV export, consistency checks and per-year citations.
- Visitor-reported pricesSubmit the price you paid and see median prices by city and year.
- ArticlesShort reads: why we count gyros instead of euros, what happened to the minimum wage 1976-2026, and what food-service CPI is.
- FAQ & sourcesWhat the index measures, where the data comes from and how Greece compares to other countries.
Counting gyros since 1976.