Period price
0.149 € → 4.30 €
+2,785.9%
Per period wrap, nominal
What changed in purchasing power. Comparisons, short stories and charts with their sources.
Collection dates describe individual samples, not a new measurement for every year in the series. A documentation update does not necessarily change prices.
Choose any two years. Compare the same product unit and wage basis, then take the figures and their context with you.
0.149 € → 4.30 €
+2,785.9%
Per period wrap, nominal
748 → 214
-71.4%
Period gyros / month, approximately
0.242 € → 4.30 €
+1,676.9%
Per classic pita gyro, nominal
111.52 € → 919.72 €
+724.7%
Annual income ÷ 12, nominal
461 → 214
-53.6%
Classic pita gyros / month, approximately
1986 · Sources
Price evidence: D · Interpolated inside the price-control era, or projected outside the documented range
2026 · Sources
Price evidence: B · Regulated, single-source or an estimate with a range
Nominal price and wage changes, without inflation adjustment. Percentage changes use unrounded ratios; displayed counts are rounded. Historical euros use the fixed drachma conversion, not today's purchasing power.
Read and share
One question, one picture. Four stories from the baseline series, in landscape and portrait layouts. Every download keeps its release, source and explanatory notes.
These are fixed comparisons and do not change with the page’s year selections. Use the page’s EL / EN switch for the other language.
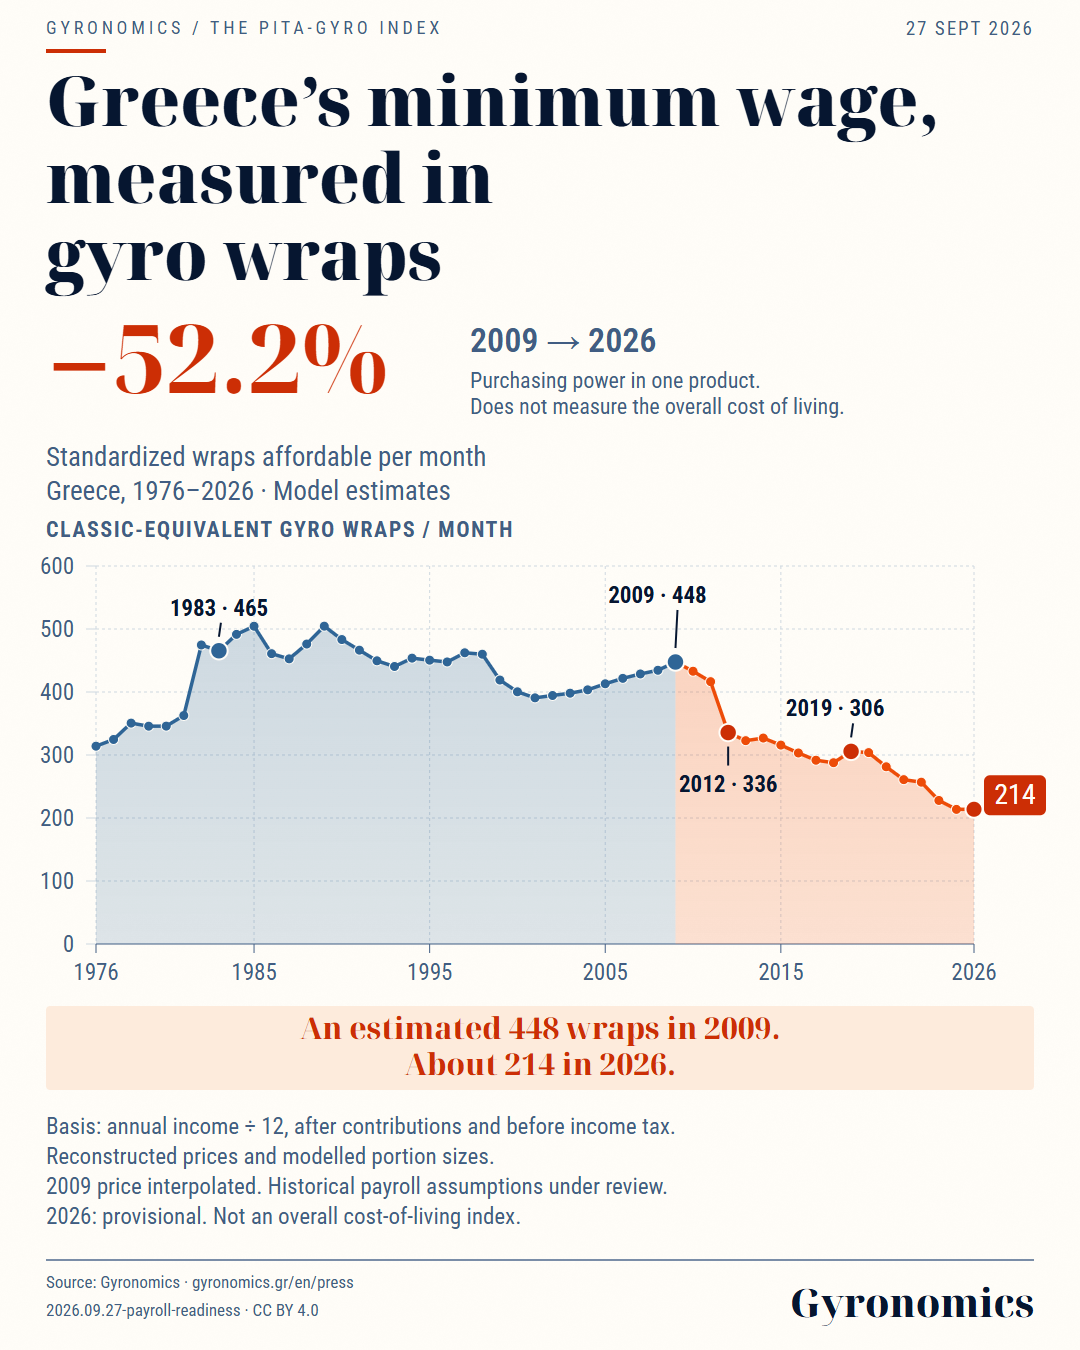
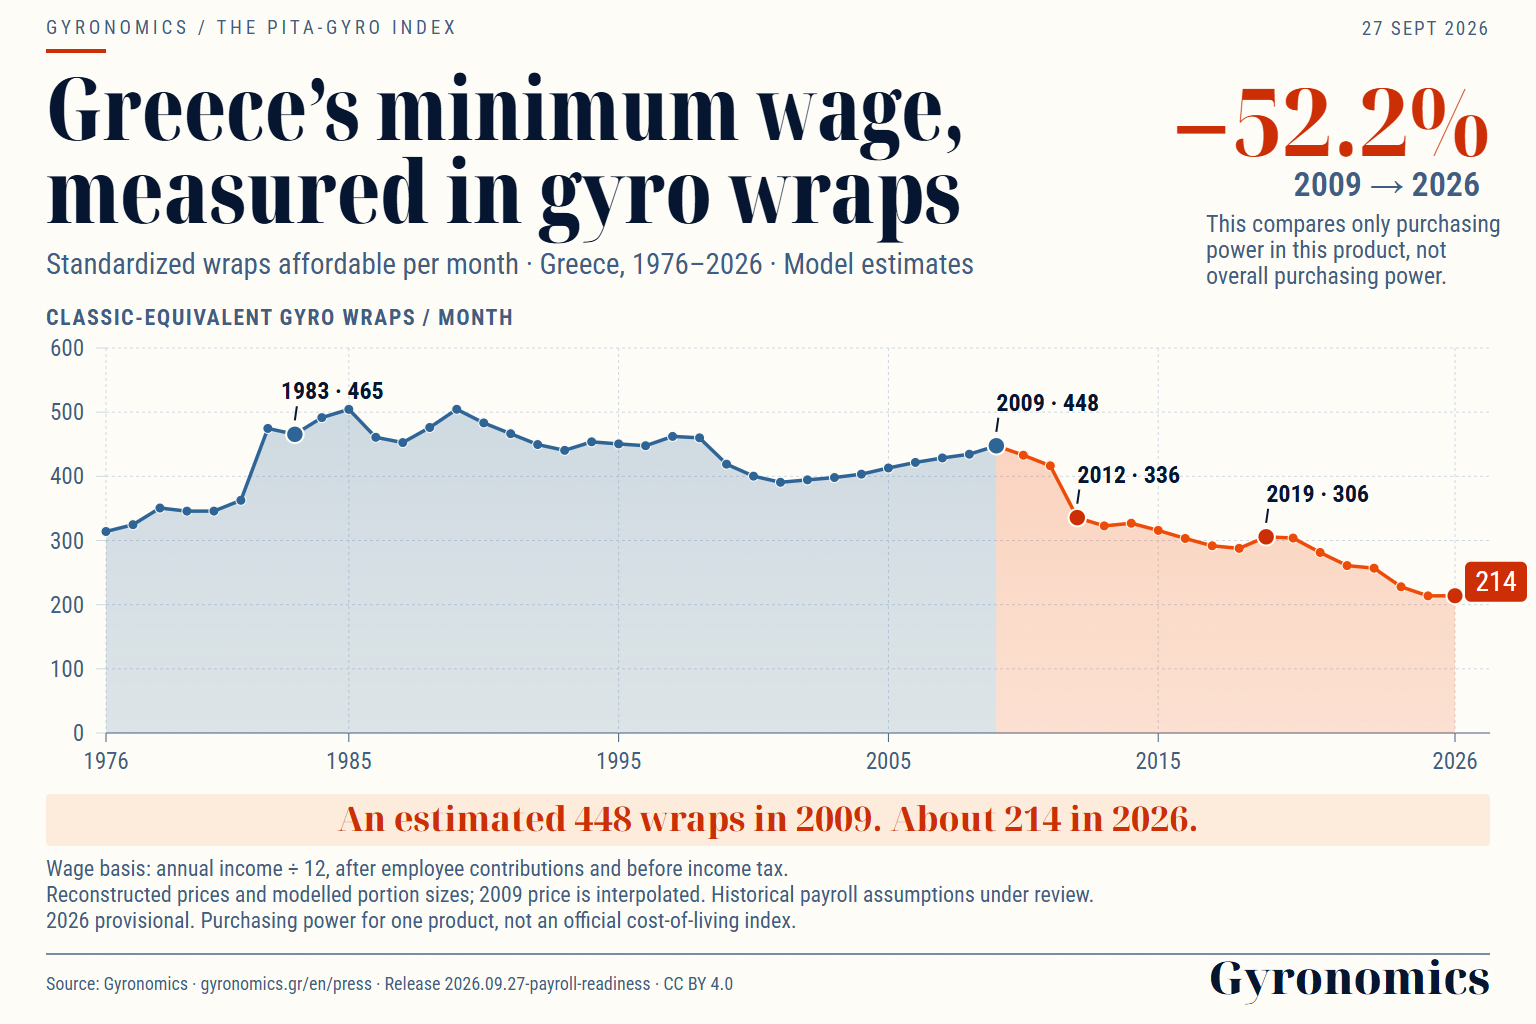
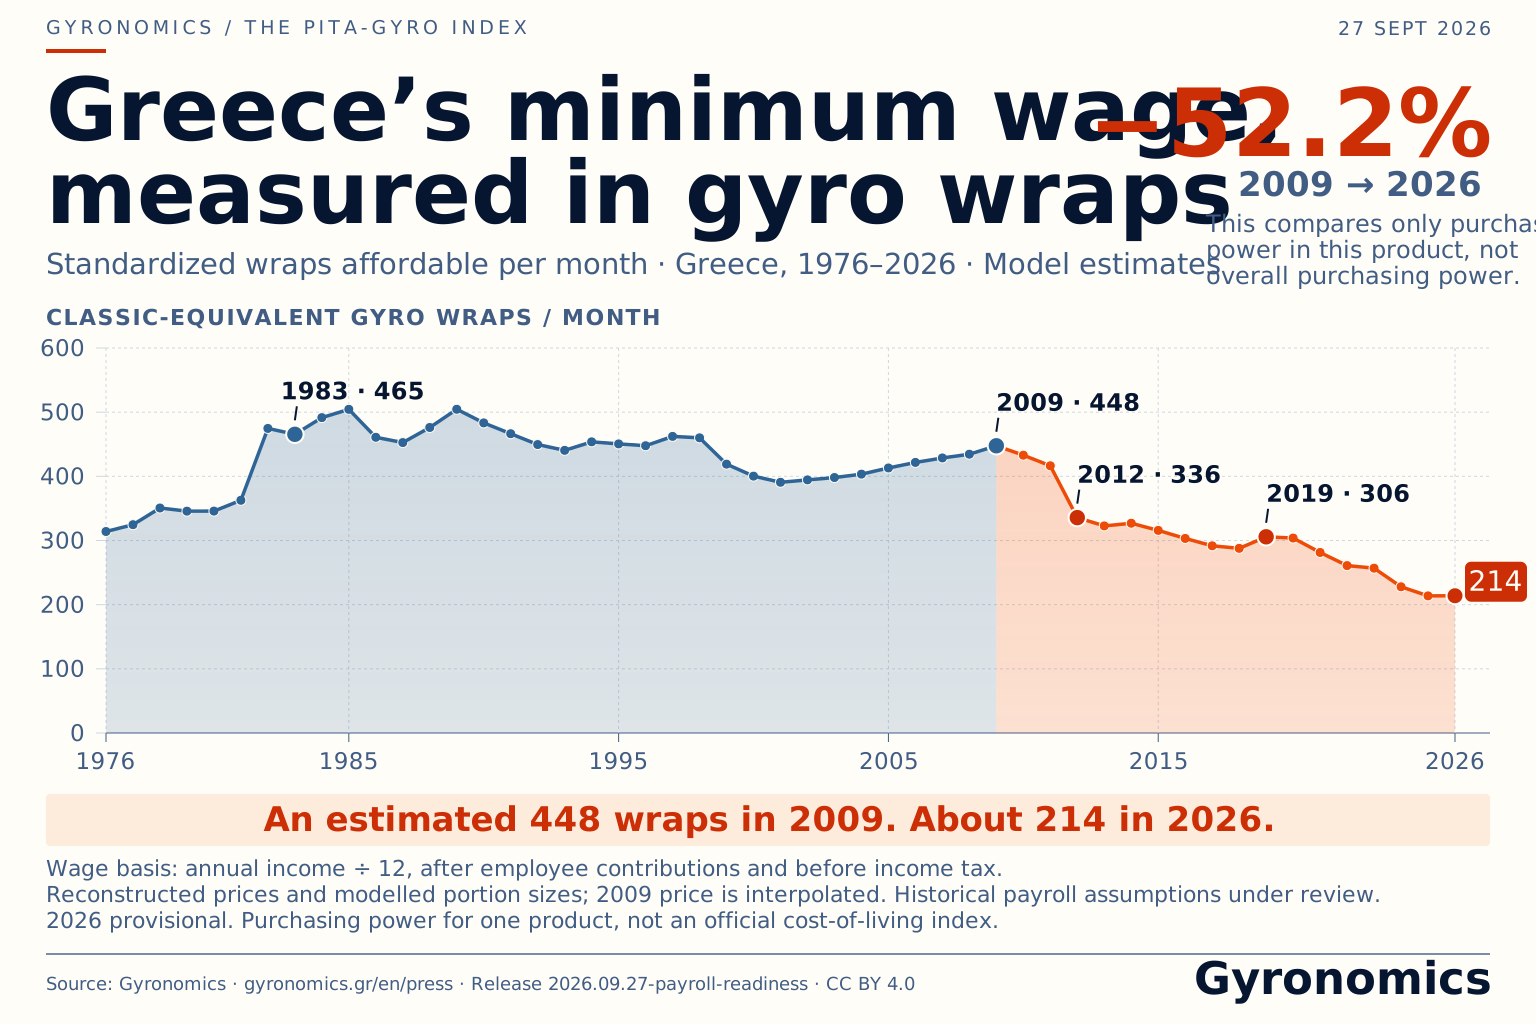
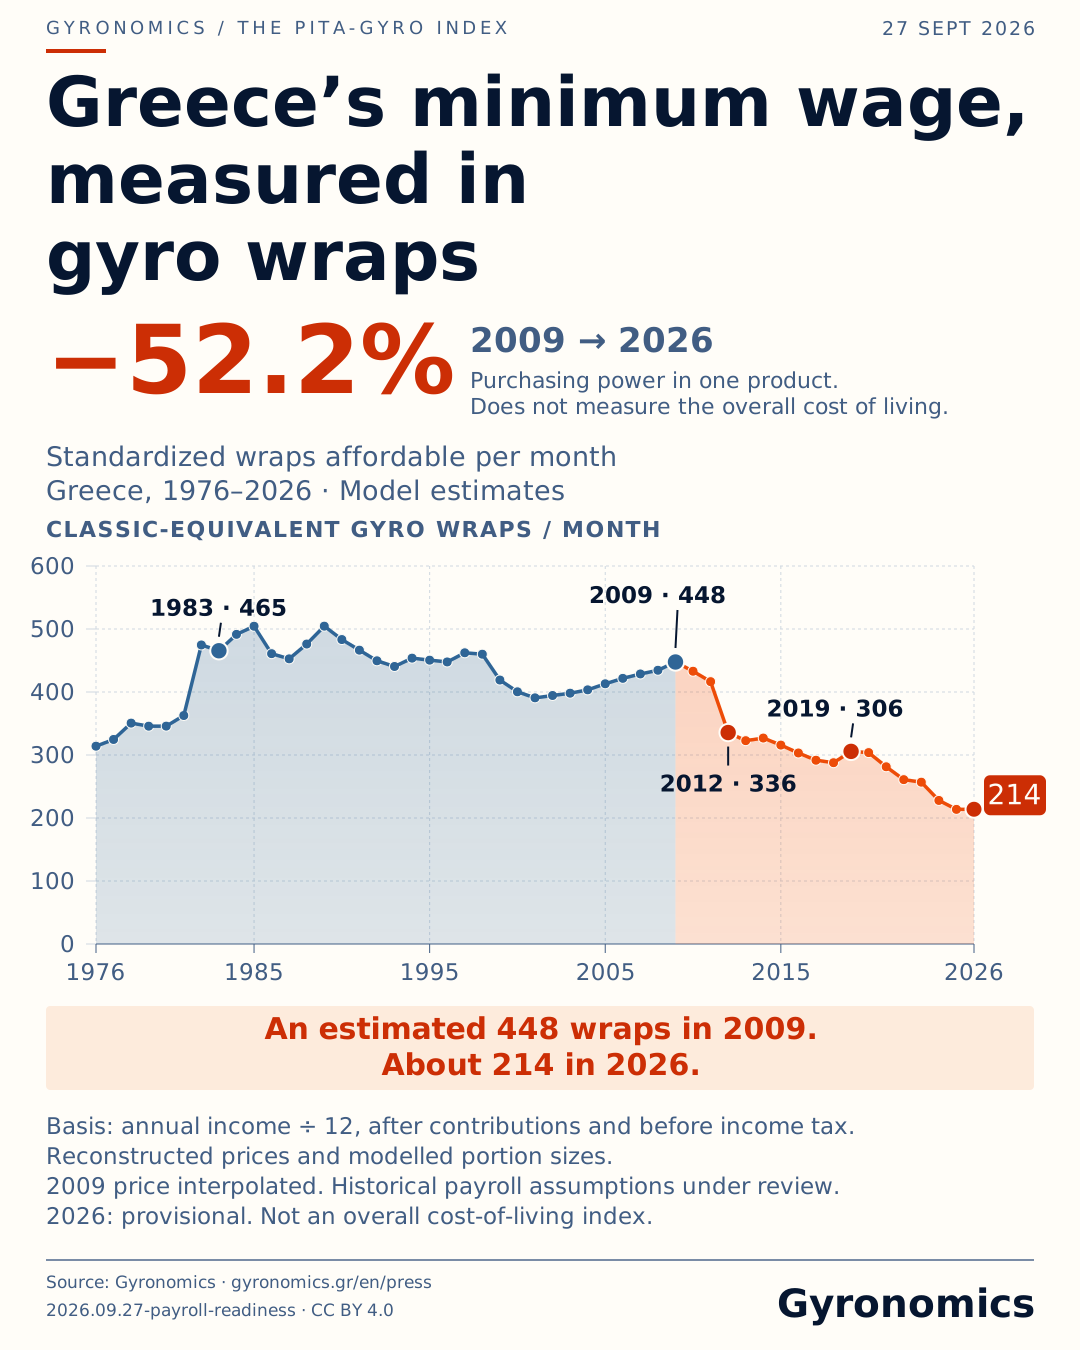
Greece’s minimum wage, measured in gyro wraps
The journey from 1976 to 2026. About 214 classic-equivalent gyros per month in the latest series year.
Release: 2026.09.27-payroll-readiness · CC BY 4.0
Immutable image dataset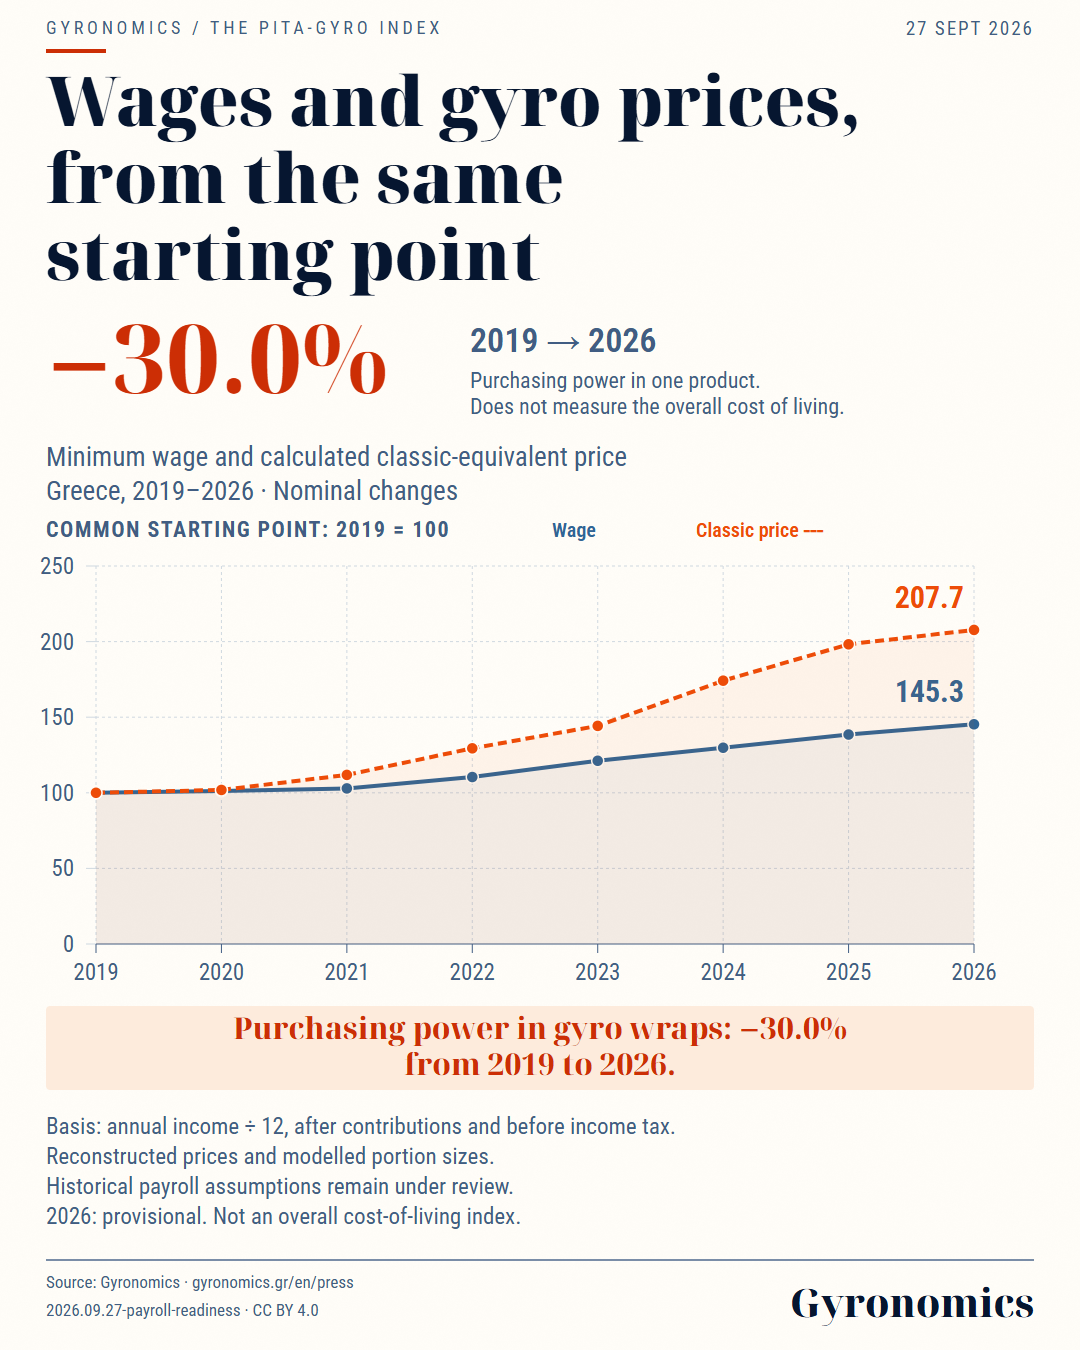
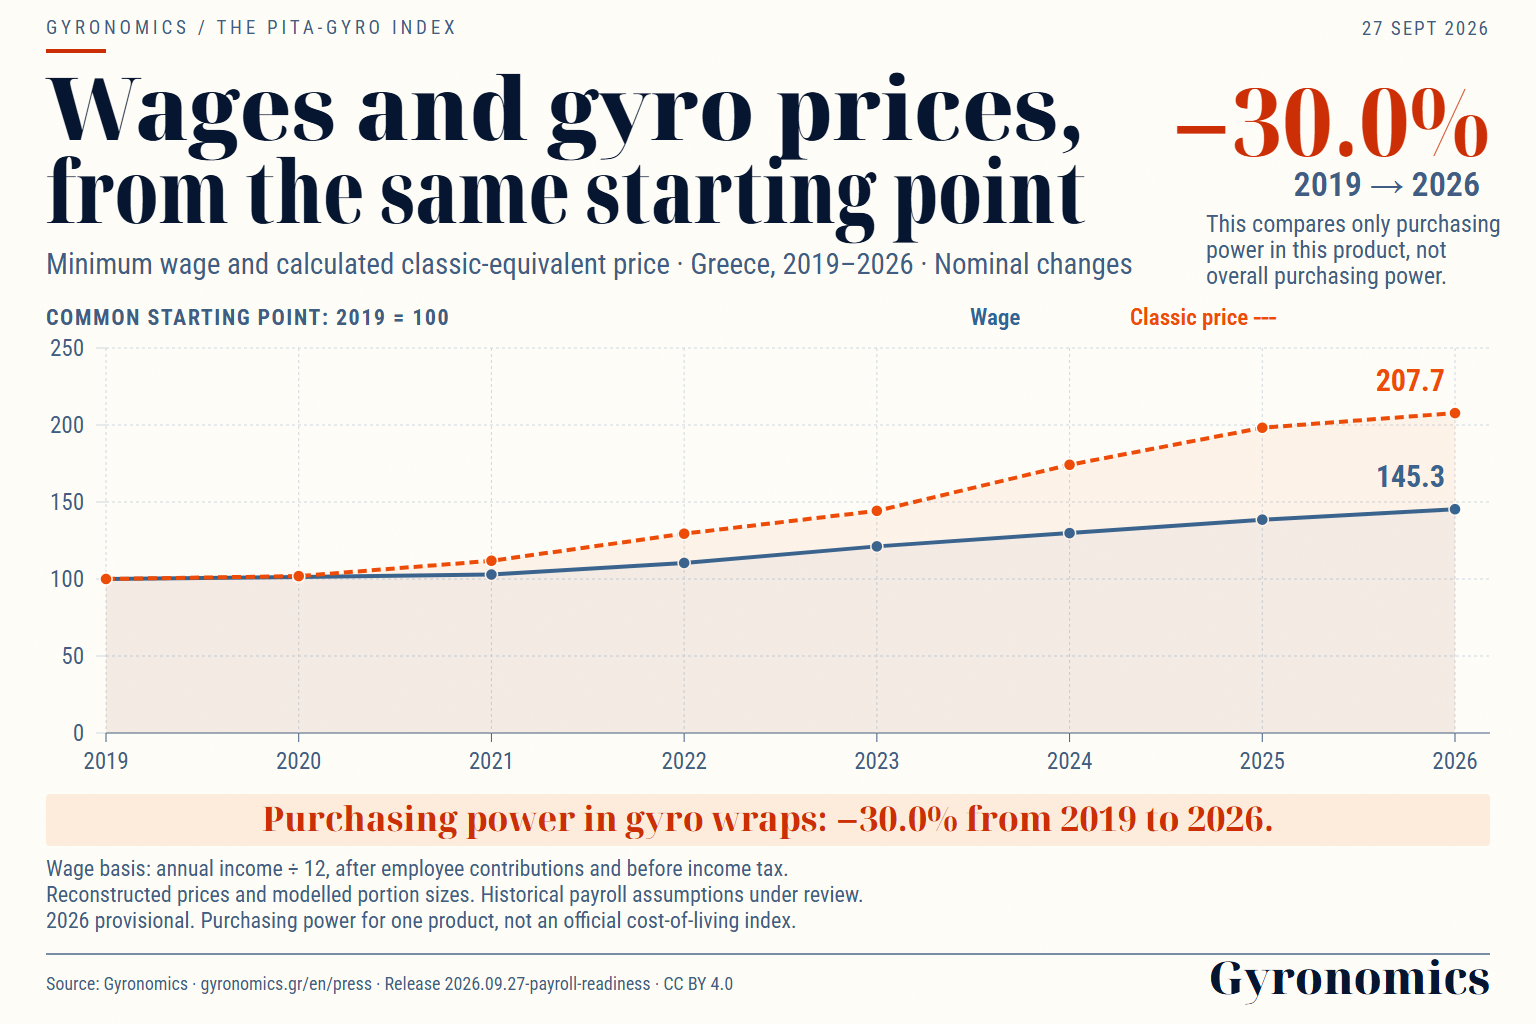
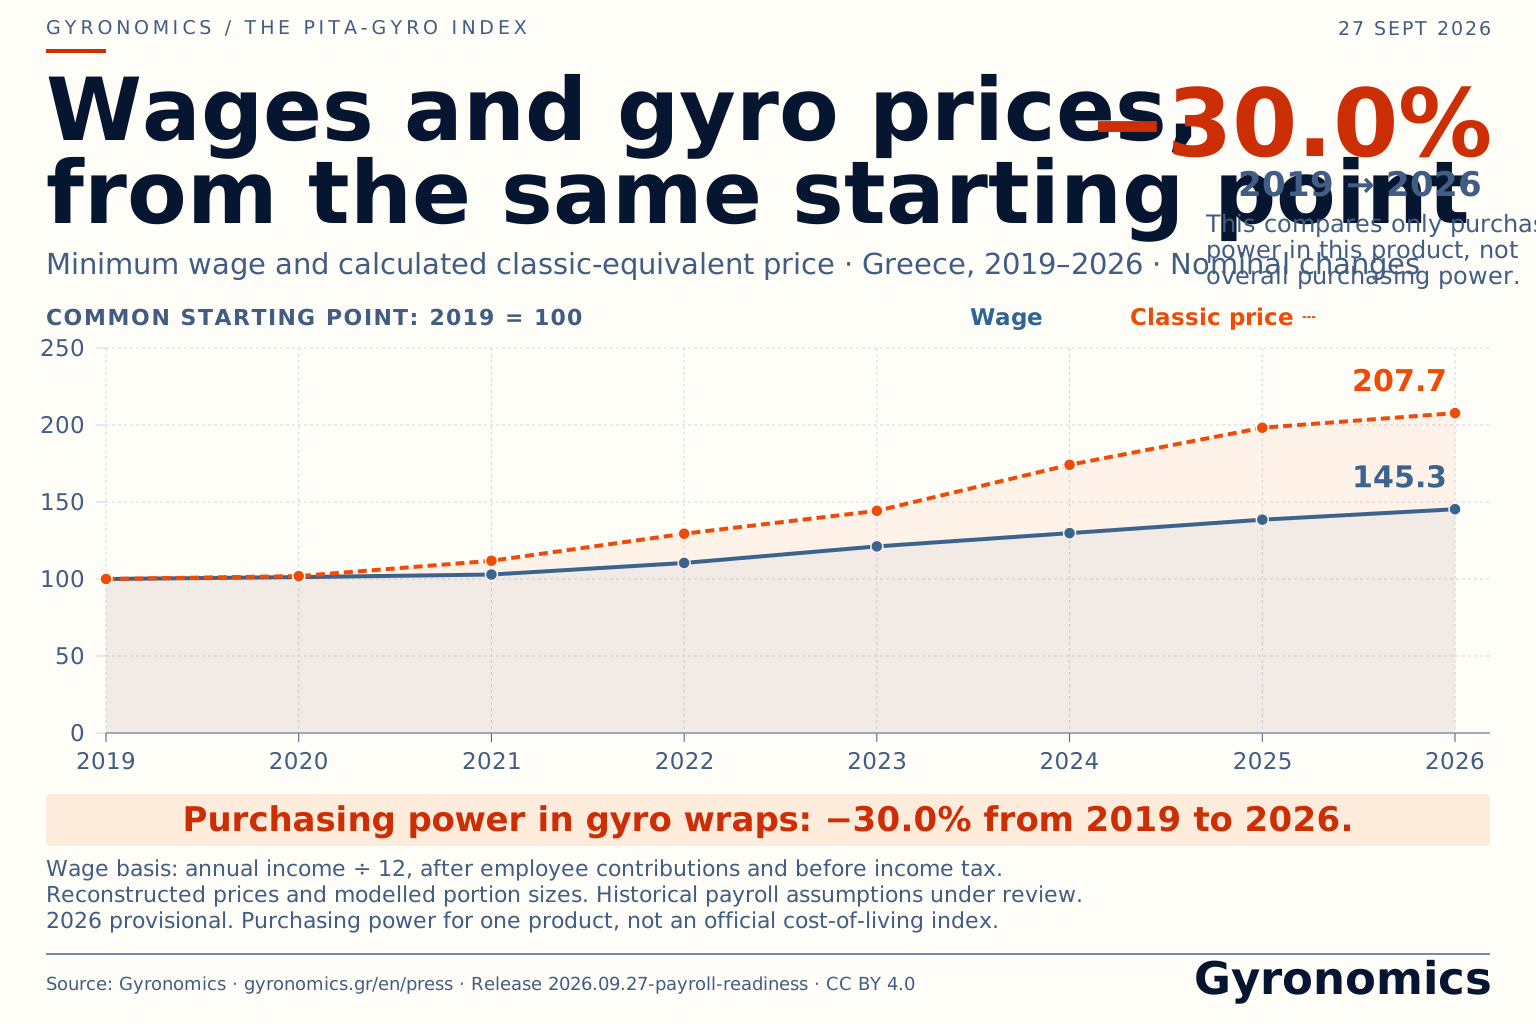
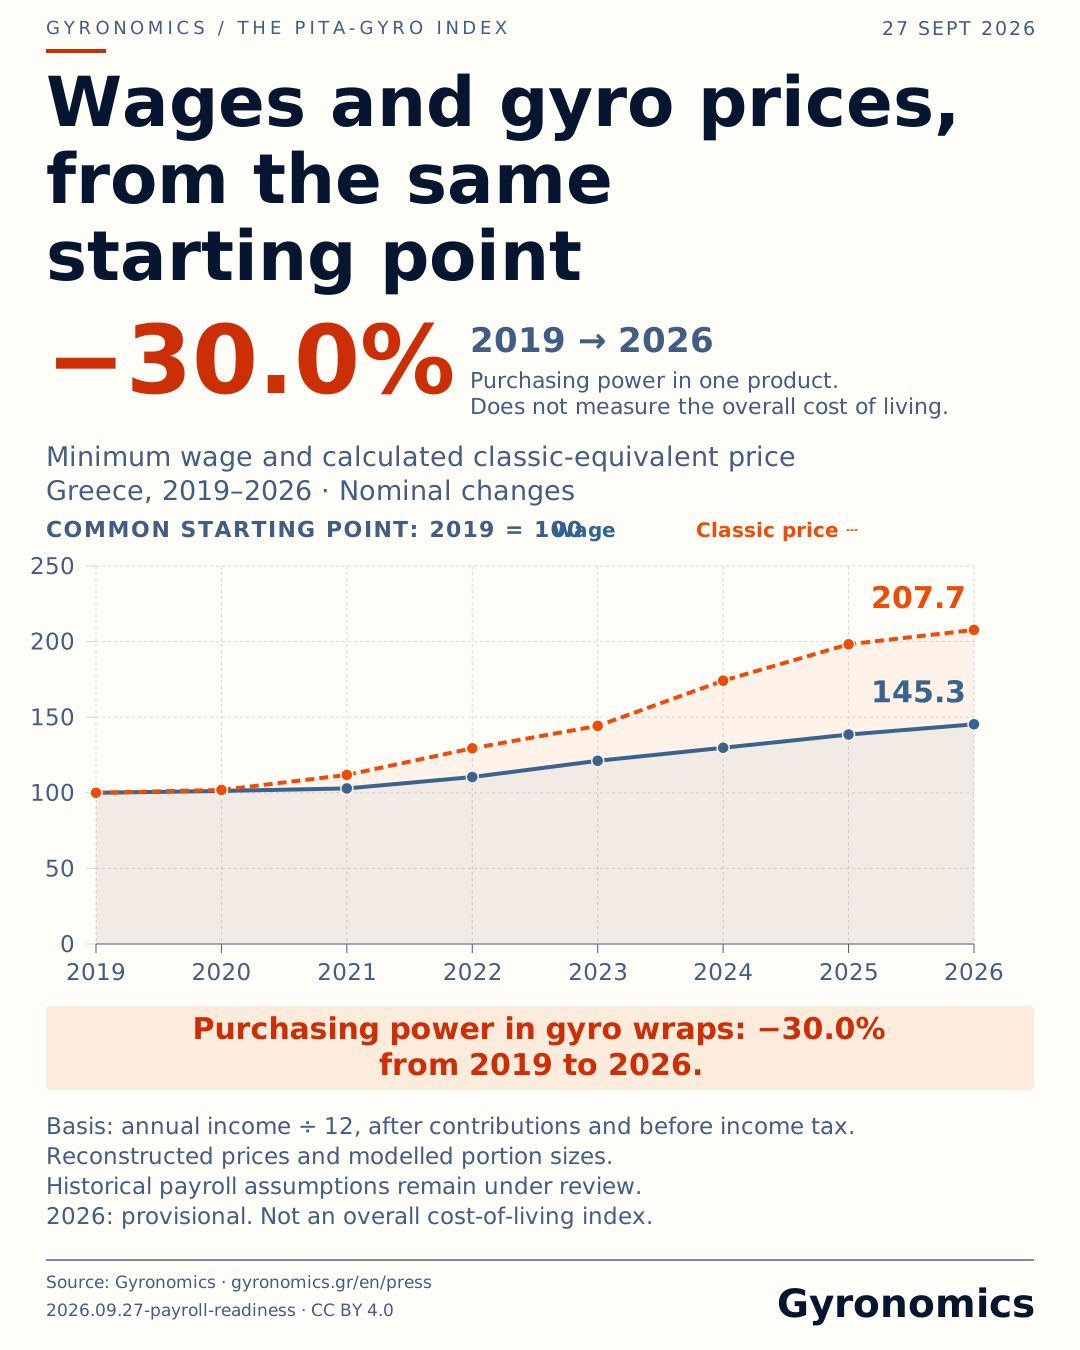
Did wages keep pace with the price?
Wage and calculated classic-gyro price, both starting at 2019 = 100. Nominal changes.
Release: 2026.09.27-payroll-readiness · CC BY 4.0
Immutable image dataset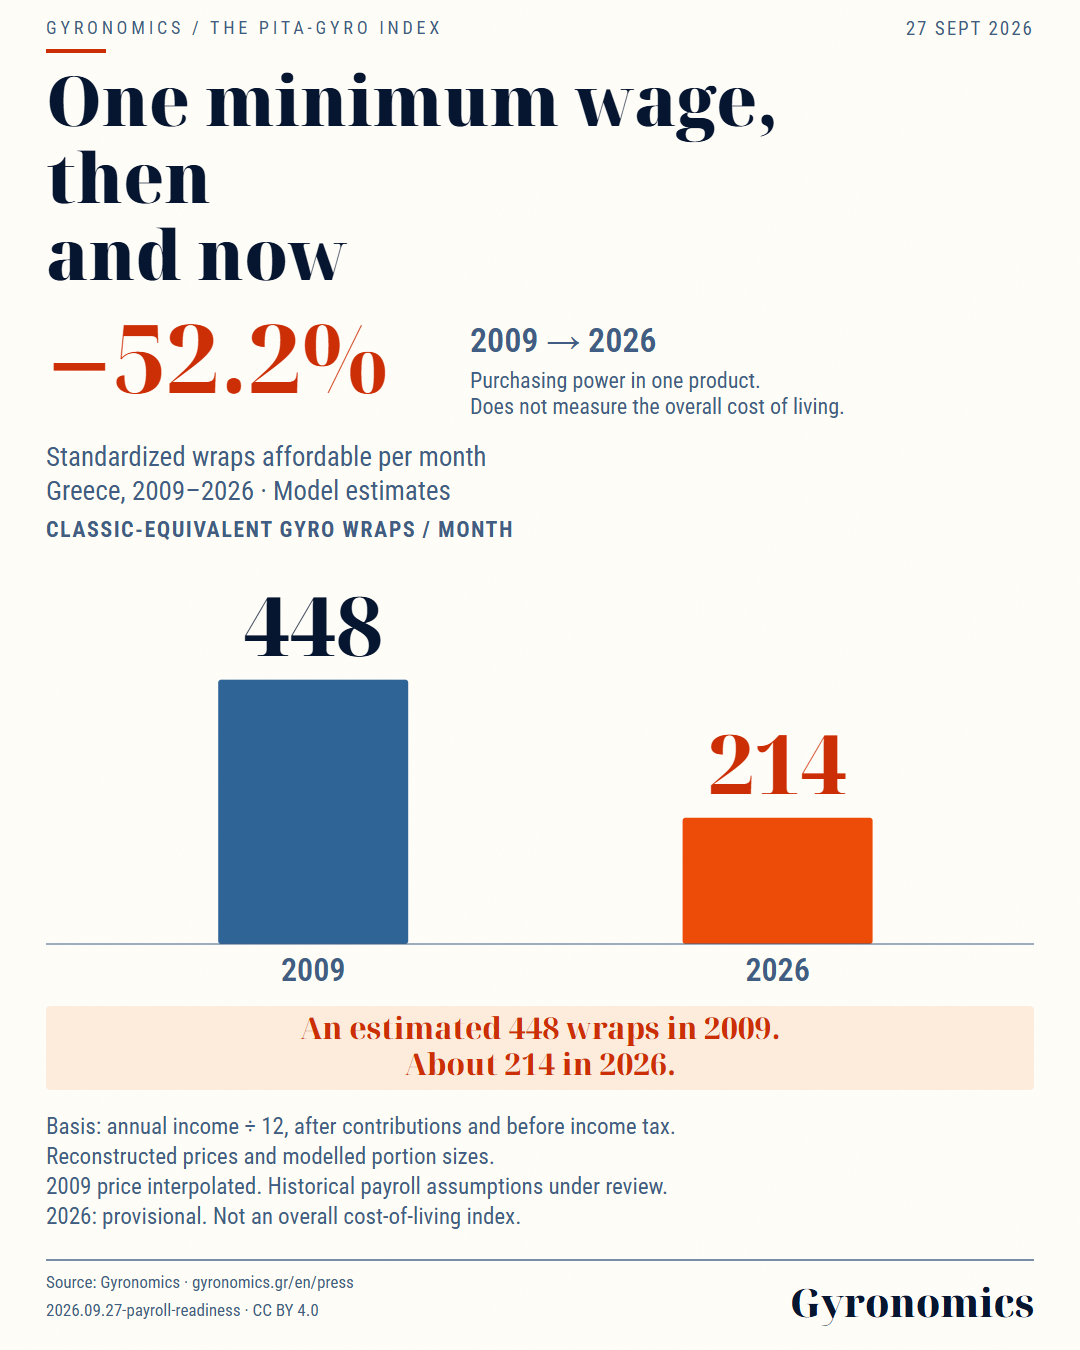
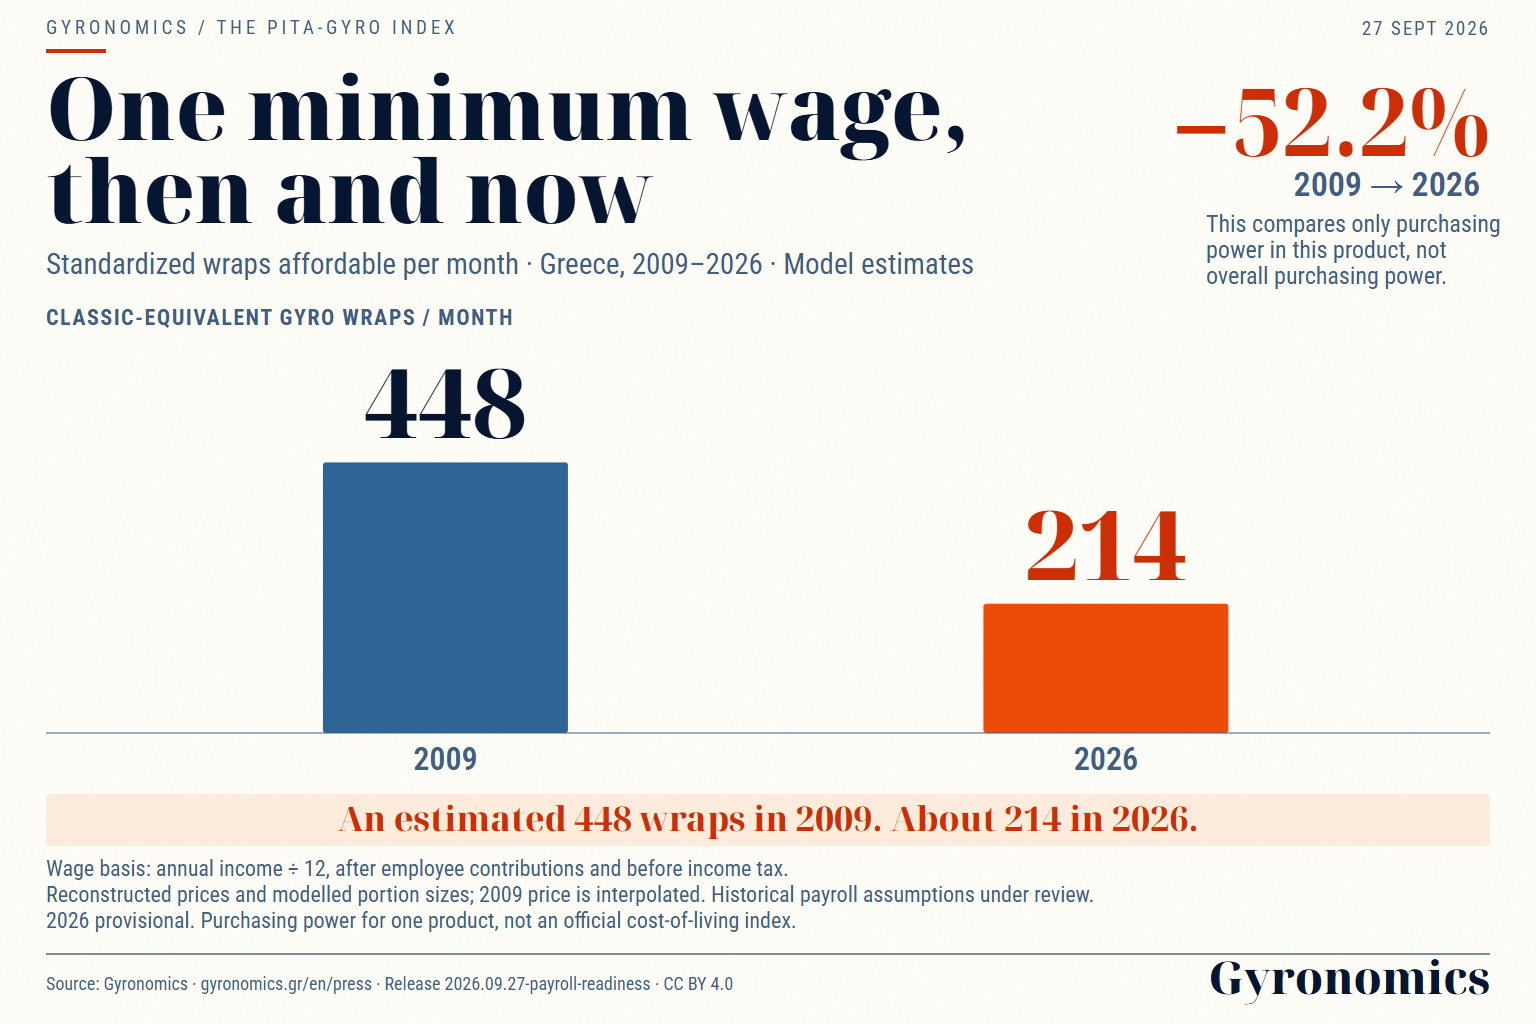
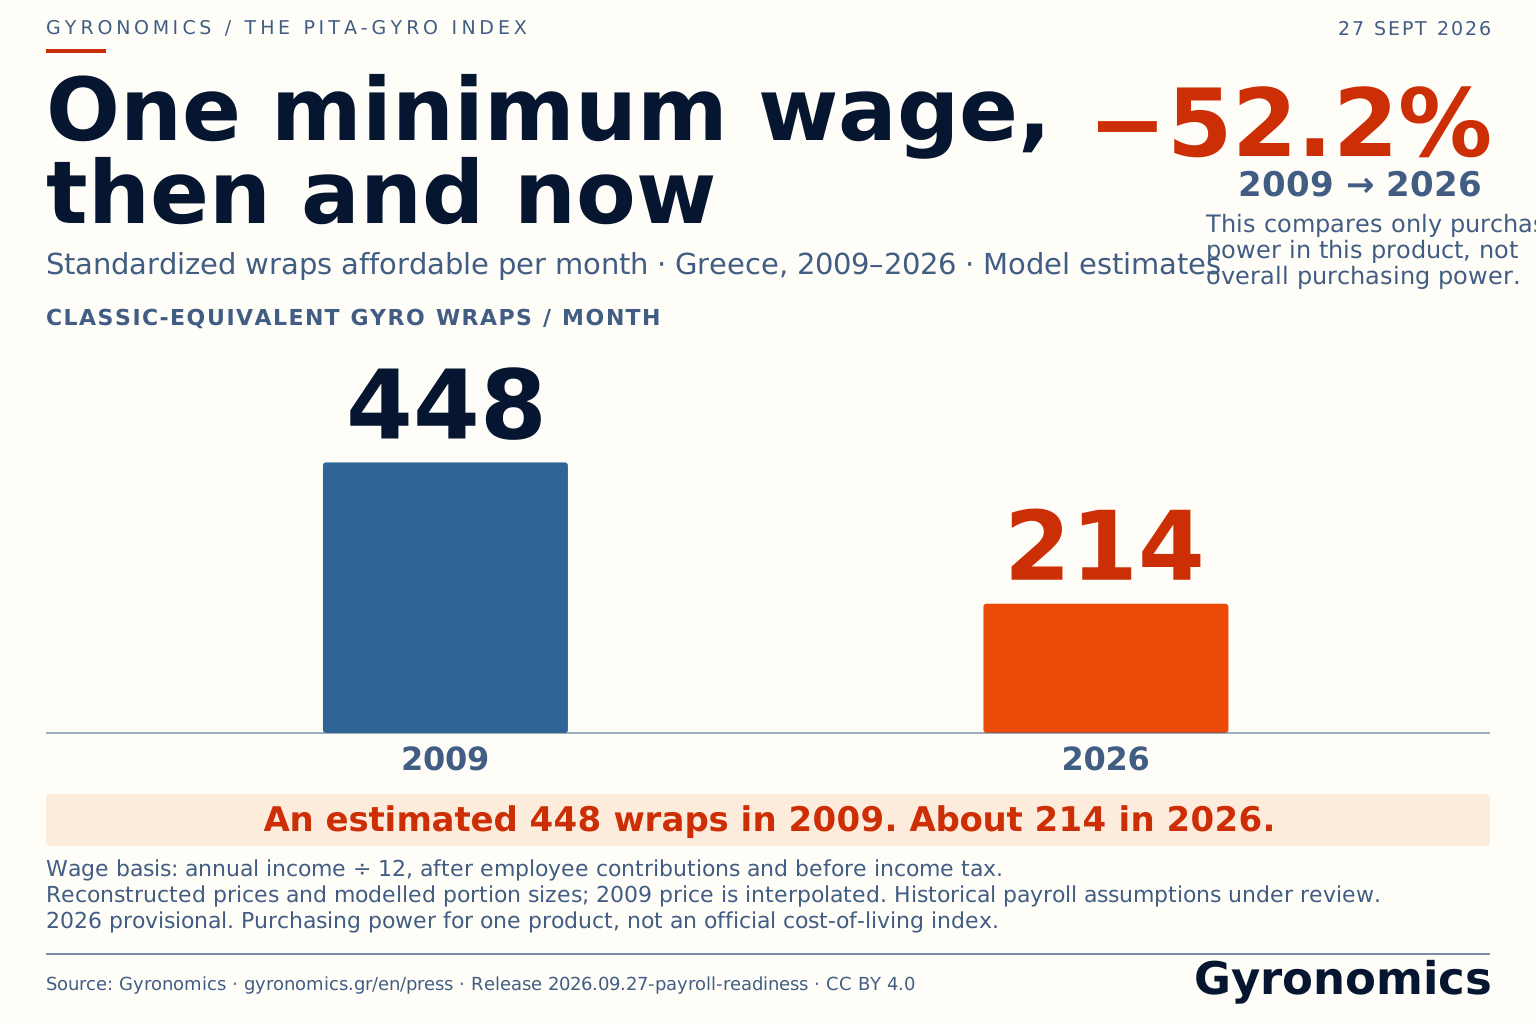
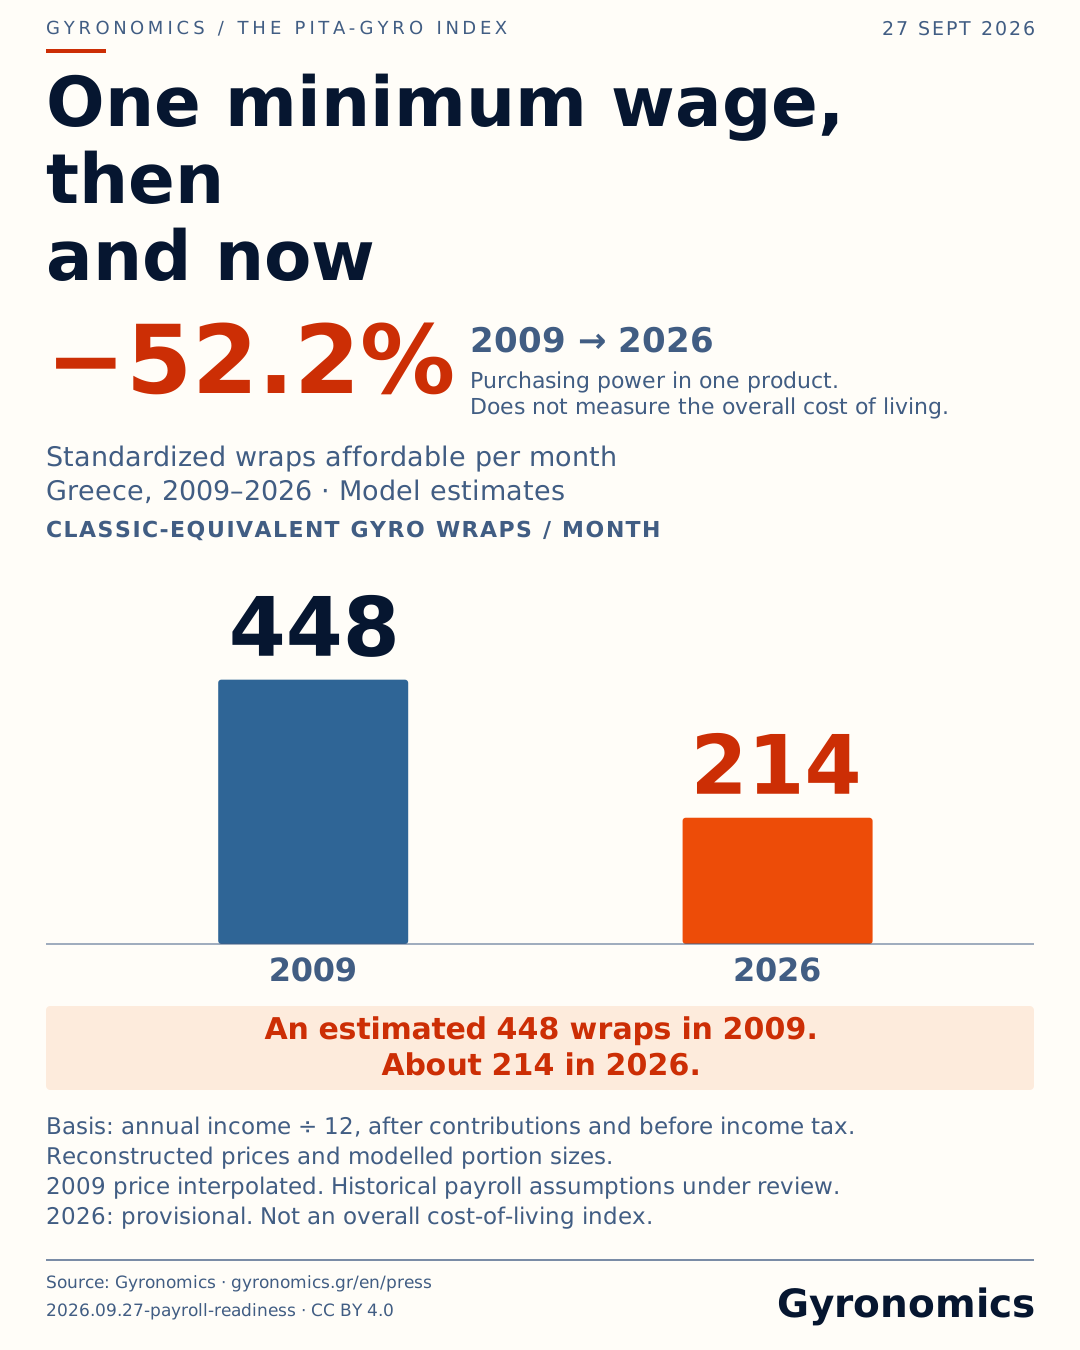
Then and now
2009 → 2026: about 448 → 214 classic-equivalent gyros per month. Change: −52.2%, calculated before rounding.
Release: 2026.09.27-payroll-readiness · CC BY 4.0
Immutable image dataset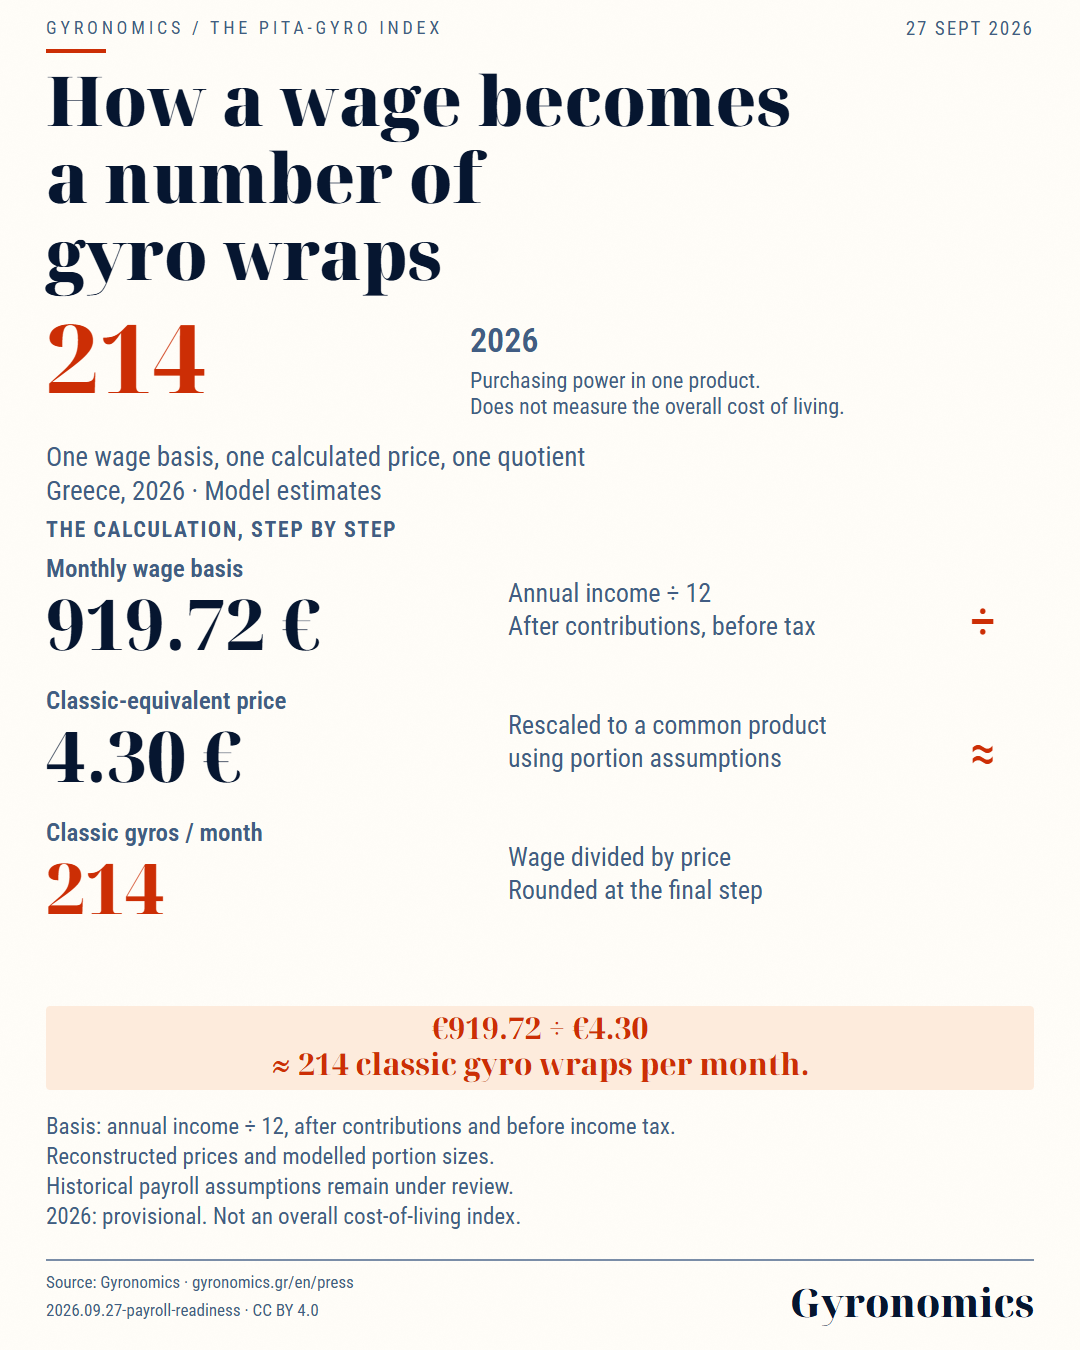
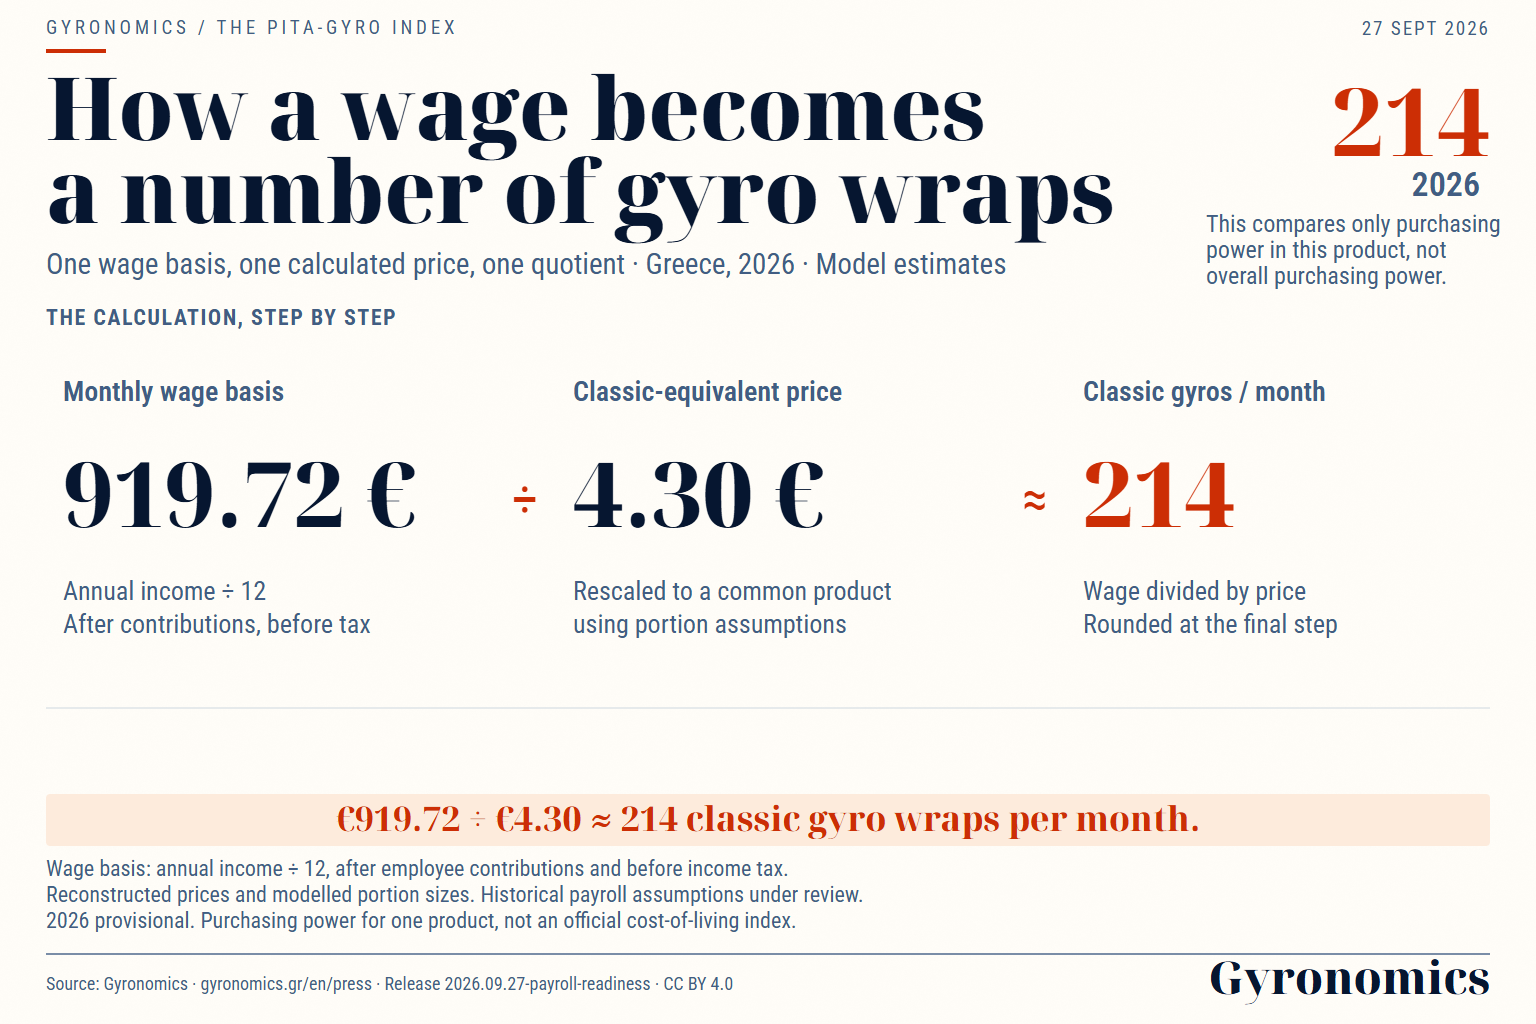
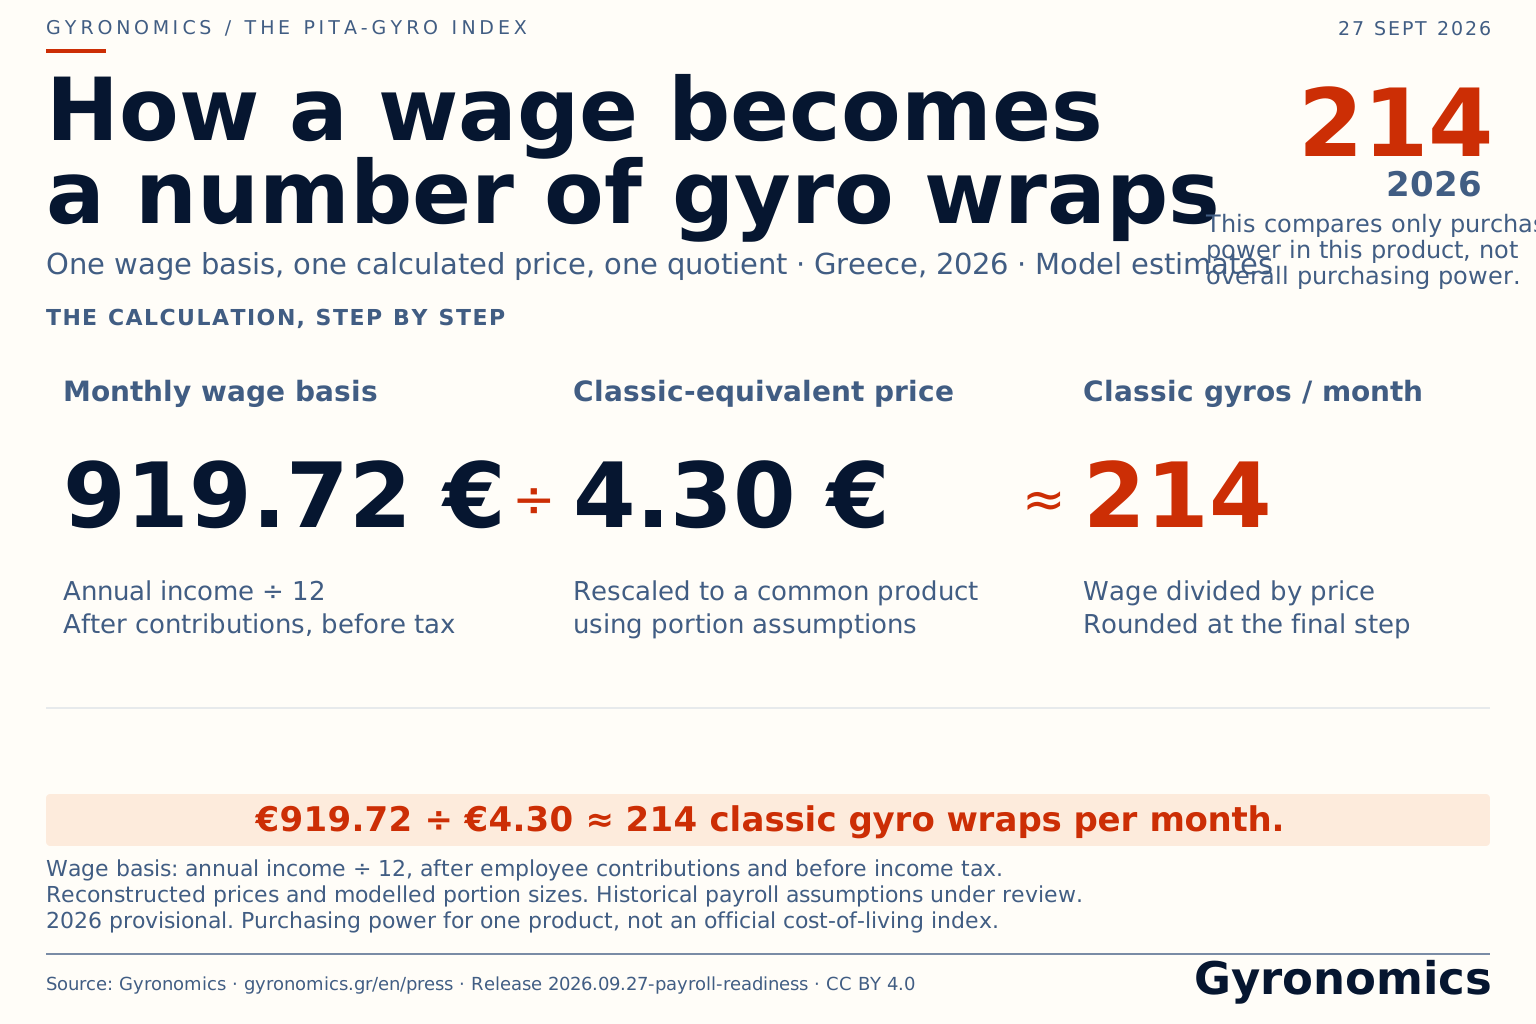
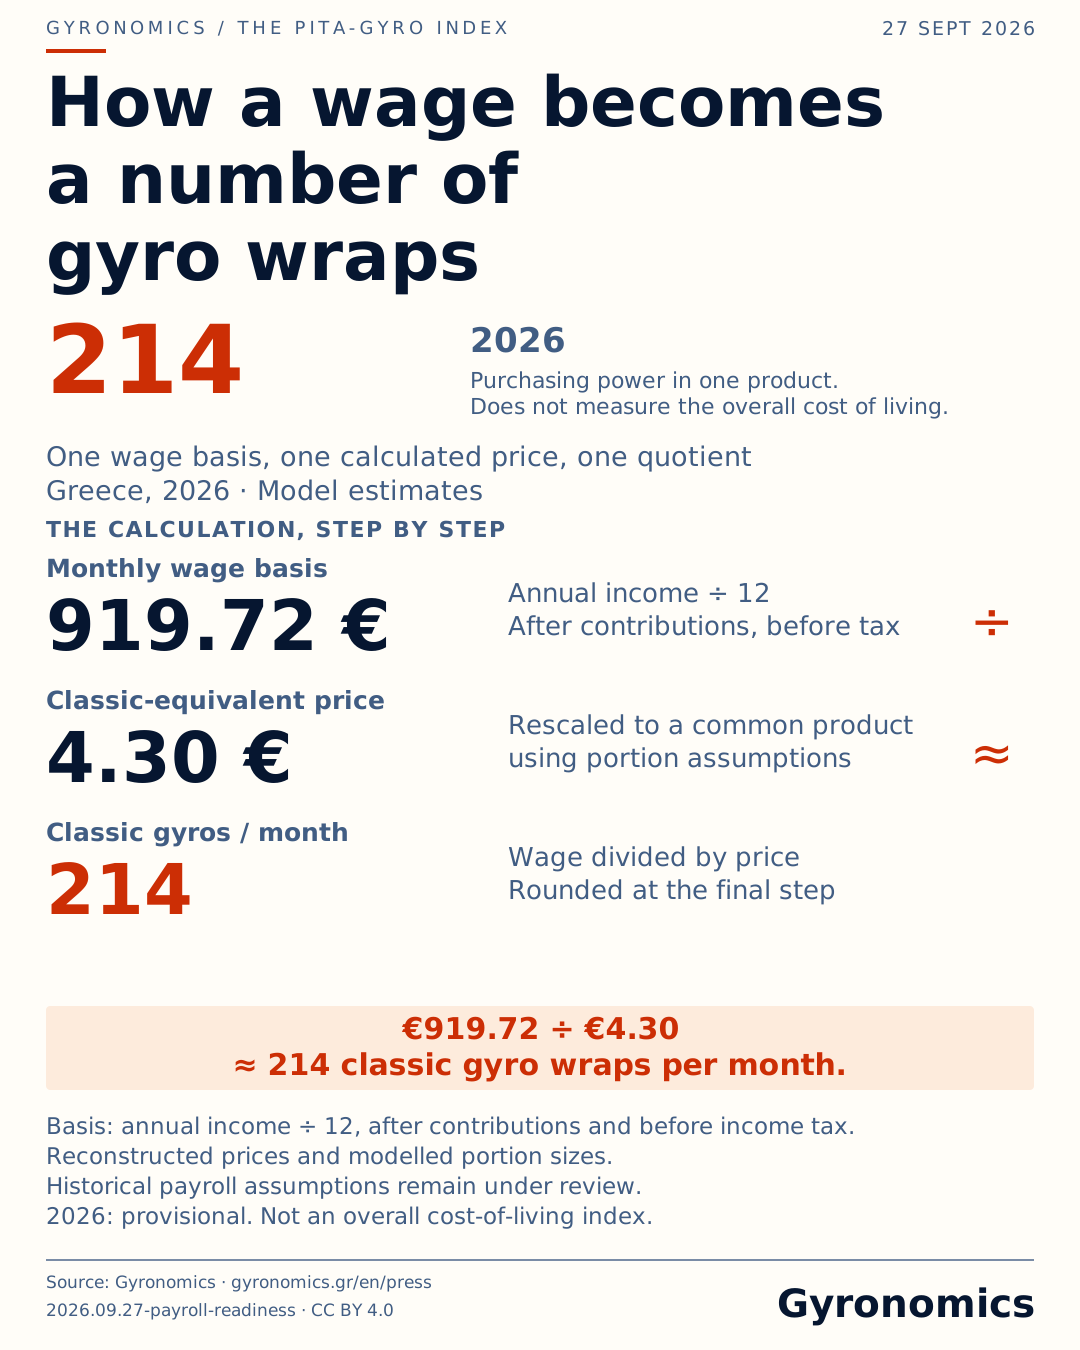
How is the index calculated?
2026: annual income ÷ 12 = €919.72 per month. Dividing by the calculated classic price of €4.30 gives about 214 classic-equivalent gyros.
Release: 2026.09.27-payroll-readiness · CC BY 4.0
Immutable image datasetTwo endpoints do not tell the whole story. Read the intervening years and their evidence grades before drawing conclusions.
| Year | Price (€) | Wage (€) | Gyros / month | Price evidence |
|---|---|---|---|---|
| 1976 | 0.05 | 15.70 | 314 | D · Interpolated inside the price-control era, or projected outside the documented range |
| 1977 | 0.056 | 18.18 | 325 | B · Regulated, single-source or an estimate with a range |
| 1978 | 0.064 | 22.44 | 351 | B · Regulated, single-source or an estimate with a range |
| 1979 | 0.075 | 25.93 | 346 | D · Interpolated inside the price-control era, or projected outside the documented range |
| 1980 | 0.091 | 31.47 | 346 | B · Regulated, single-source or an estimate with a range |
| 1981 | 0.108 | 39.17 | 363 | D · Interpolated inside the price-control era, or projected outside the documented range |
| 1982 | 0.127 | 60.28 | 475 | D · Interpolated inside the price-control era, or projected outside the documented range |
| 1983 | 0.146 | 67.96 | 465 | B · Regulated, single-source or an estimate with a range |
| 1984 | 0.174 | 85.52 | 491 | B · Regulated, single-source or an estimate with a range |
| 1985 | 0.20 | 100.88 | 504 | D · Interpolated inside the price-control era, or projected outside the documented range |
| 1986 | 0.242 | 111.52 | 461 | D · Interpolated inside the price-control era, or projected outside the documented range |
| 1987 | 0.272 | 123.11 | 453 | D · Interpolated inside the price-control era, or projected outside the documented range |
| 1988 | 0.299 | 142.36 | 476 | D · Interpolated inside the price-control era, or projected outside the documented range |
| 1989 | 0.335 | 169.01 | 505 | B · Regulated, single-source or an estimate with a range |
| 1990 | 0.409 | 197.65 | 483 | C · Interpolated between model anchors |
| 1991 | 0.481 | 224.34 | 466 | C · Interpolated between model anchors |
| 1992 | 0.554 | 249.04 | 450 | C · Interpolated between model anchors |
| 1993 | 0.621 | 273.55 | 440 | C · Interpolated between model anchors |
| 1994 | 0.679 | 308.09 | 454 | C · Interpolated between model anchors |
| 1995 | 0.747 | 336.54 | 451 | C · Interpolated between model anchors |
| 1996 | 0.812 | 363.52 | 448 | C · Interpolated between model anchors |
| 1997 | 0.848 | 391.98 | 462 | C · Interpolated between model anchors |
| 1998 | 0.898 | 413.07 | 460 | B · Regulated, single-source or an estimate with a range |
| 1999 | 1.021 | 427.79 | 419 | C · Interpolated between model anchors |
| 2000 | 1.114 | 445.94 | 400 | A · Model price anchor; source verification is separate |
| 2001 | 1.179 | 460.66 | 391 | A · Model price anchor; source verification is separate |
| 2002 | 1.23 | 485.19 | 394 | B · Regulated, single-source or an estimate with a range |
| 2003 | 1.28 | 509.60 | 398 | C · Interpolated between model anchors |
| 2004 | 1.328 | 535.73 | 403 | C · Interpolated between model anchors |
| 2005 | 1.373 | 567.09 | 413 | C · Interpolated between model anchors |
| 2006 | 1.427 | 601.72 | 422 | C · Interpolated between model anchors |
| 2007 | 1.48 | 634.39 | 429 | C · Interpolated between model anchors |
| 2008 | 1.551 | 673.91 | 435 | C · Interpolated between model anchors |
| 2009 | 1.591 | 712.17 | 448 | C · Interpolated between model anchors |
| 2010 | 1.674 | 724.77 | 433 | C · Interpolated between model anchors |
| 2011 | 1.75 | 728.74 | 416 | B · Regulated, single-source or an estimate with a range |
| 2012 | 1.781 | 597.78 | 336 | C · Interpolated between model anchors |
| 2013 | 1.769 | 570.94 | 323 | C · Interpolated between model anchors |
| 2014 | 1.757 | 574.36 | 327 | C · Interpolated between model anchors |
| 2015 | 1.83 | 577.78 | 316 | B · Regulated, single-source or an estimate with a range |
| 2016 | 1.899 | 575.78 | 303 | C · Interpolated between model anchors |
| 2017 | 1.969 | 574.36 | 292 | C · Interpolated between model anchors |
| 2018 | 1.996 | 574.36 | 288 | C · Interpolated between model anchors |
| 2019 | 2.07 | 632.89 | 306 | A · Model price anchor; source verification is separate |
| 2020 | 2.109 | 640.75 | 304 | B · Regulated, single-source or an estimate with a range |
| 2021 | 2.315 | 651.26 | 281 | A · Model price anchor; source verification is separate |
| 2022 | 2.679 | 698.89 | 261 | A · Model price anchor; source verification is separate |
| 2023 | 2.986 | 766.95 | 257 | B · Regulated, single-source or an estimate with a range |
| 2024 | 3.605 | 821.46 | 228 | A · Model price anchor; source verification is separate |
| 2025 | 4.103 | 876.77 | 214 | A · Model price anchor; source verification is separate |
| 2026 | 4.30 | 919.72 | 214 | B · Regulated, single-source or an estimate with a range |
For your selected comparison (1986 → 2026), purchasing power fell: -53.6%. The result comes from dividing the wage by the reference price. It does not isolate the effects of policy, taxes or business costs.
Change the comparison →The wrap has changed: portion size and ingredients differ across decades. Comparing only the menu price would mix price changes with changes in the product. The classic unit adjusts for composition using a model. Its assumptions belong alongside any long-run comparison.
How the adjustment works →A point on a chart may come from a documented price, a regulated price, an estimate or interpolation. Those are not equally strong observations. The evidence grades describe the price input; they do not certify every assumption in the purchasing-power model. Follow each year's sources before treating a movement as a historical finding.
Read the methodology →4.30 €
Per classic pita gyro
919.72 €
Annual income ÷ 12, after contributions, before income tax
214
Classic pita gyros per month, approximately
The wage basis and qualification belong with the number.
Price evidence: B · Regulated, single-source or an estimate with a range.
Check this year's sources and calculation →Download a PNG or an editable SVG. Keep the explanatory notes and attribution visible.
Reuse with attribution to Gyronomics and a link to the source under CC BY 4.0. These downloads point to the immutable baseline dataset used here. Keep its full link when citing it. Links to comparison pages open the live view, which may change after a data update.