24 August 2026· ≈ 2 min read· figures updated 10 October 2026 (release 2026.10.10-monthly-bulletin)
51 years of minimum wage in four phases, and what each one meant in practice.
In this article
The short answer
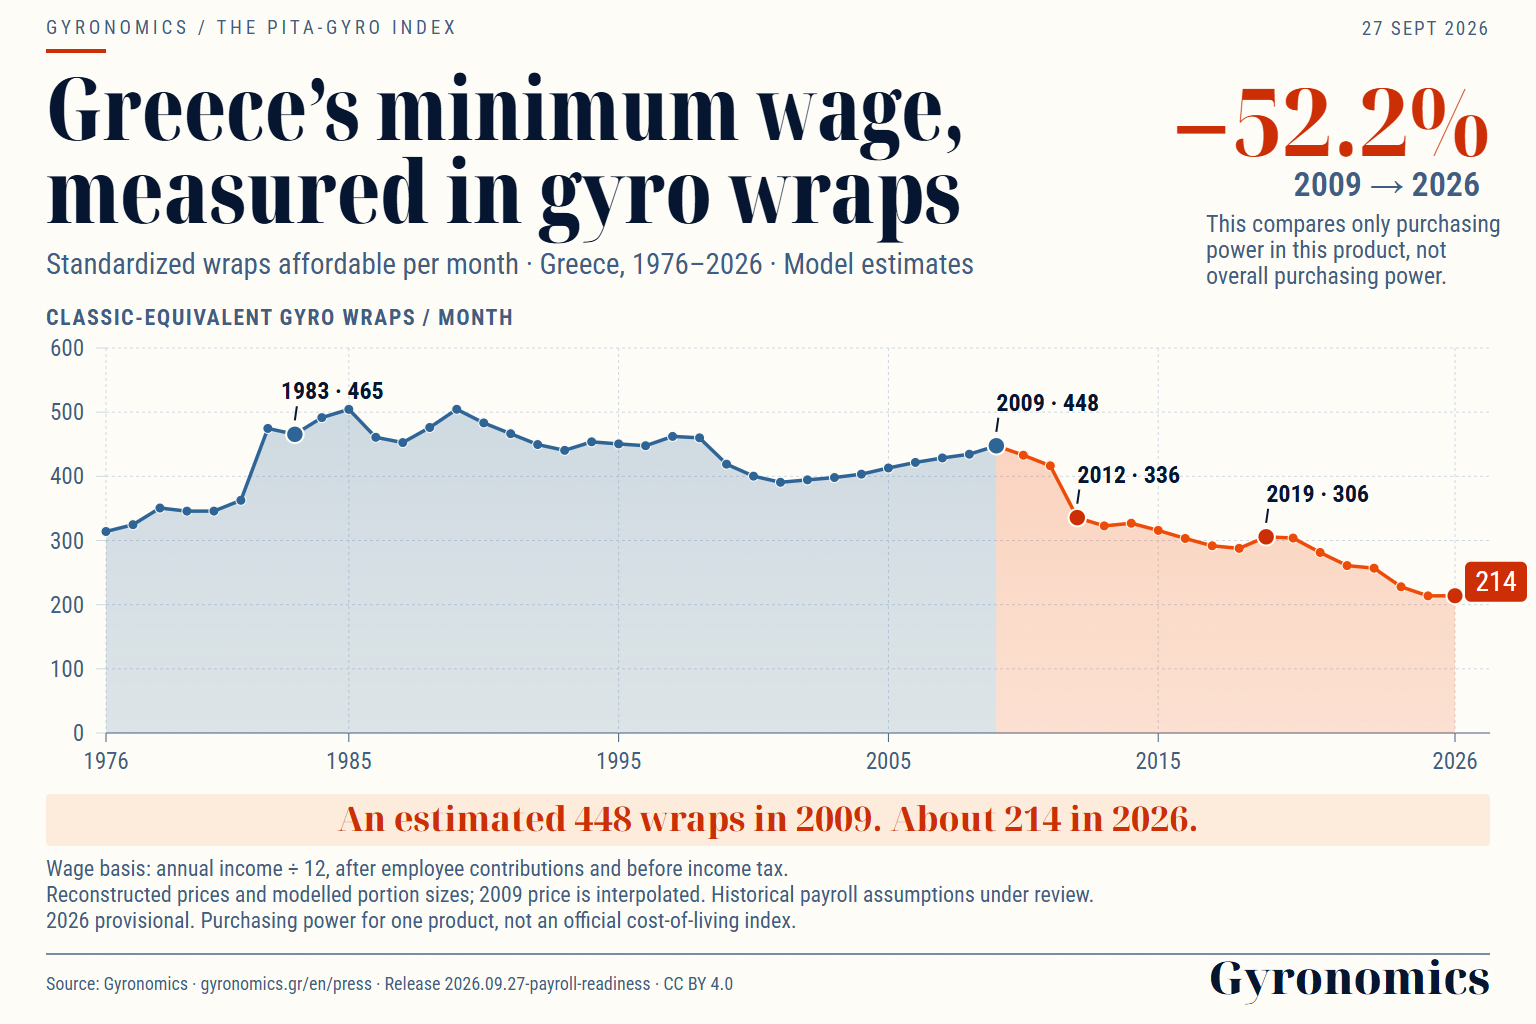
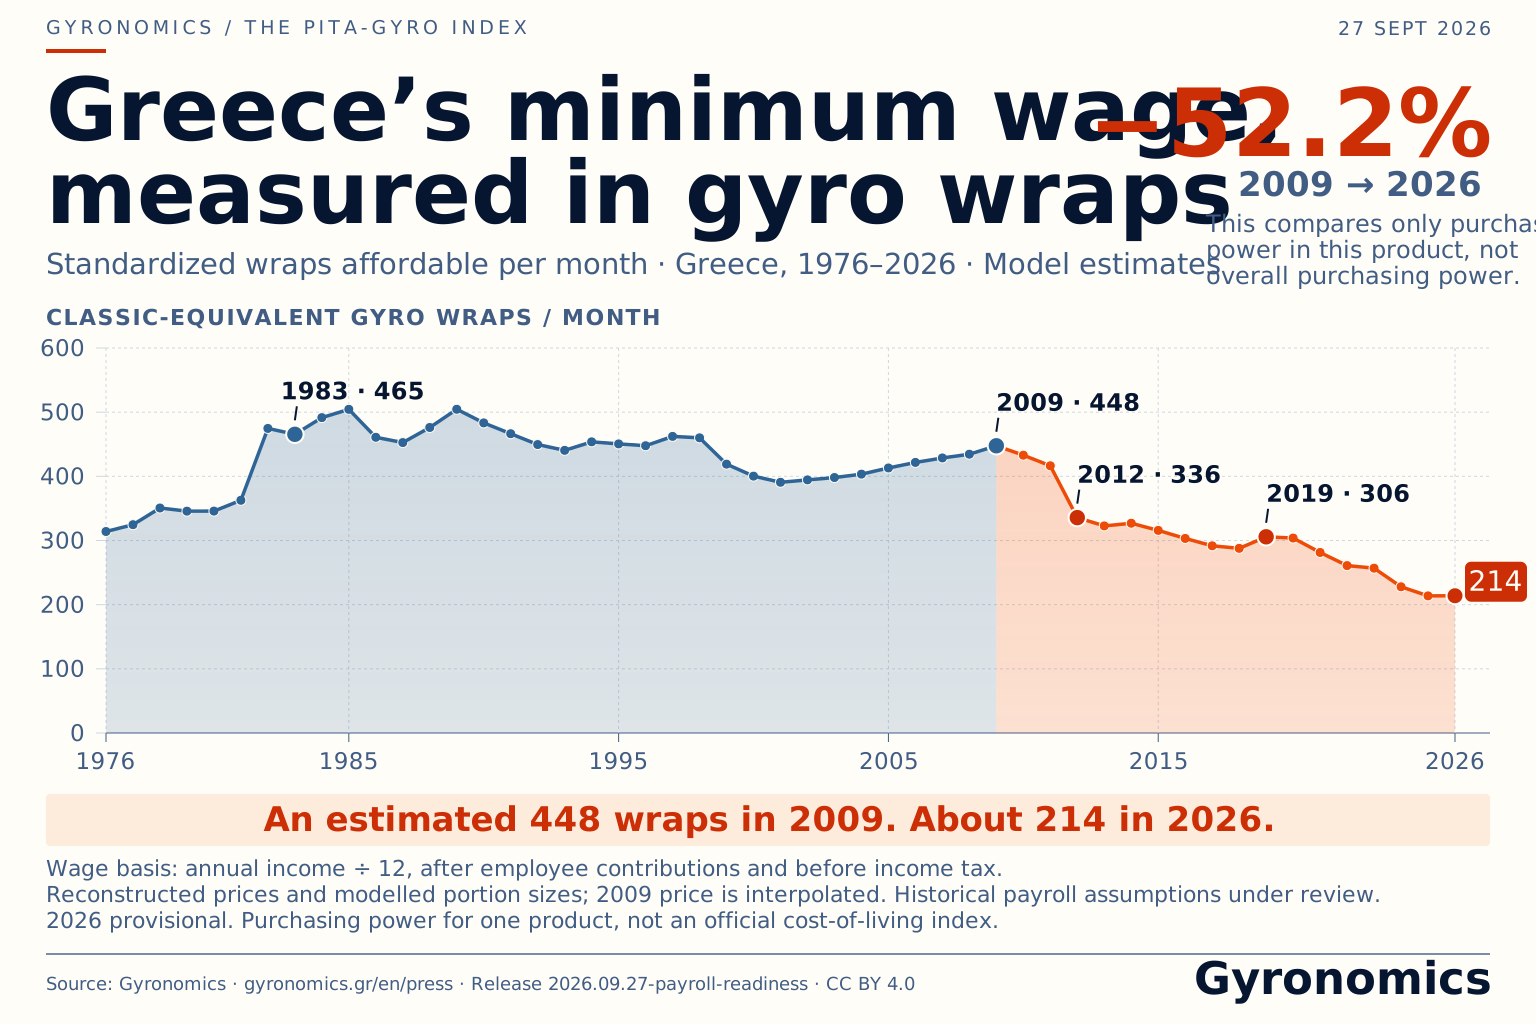
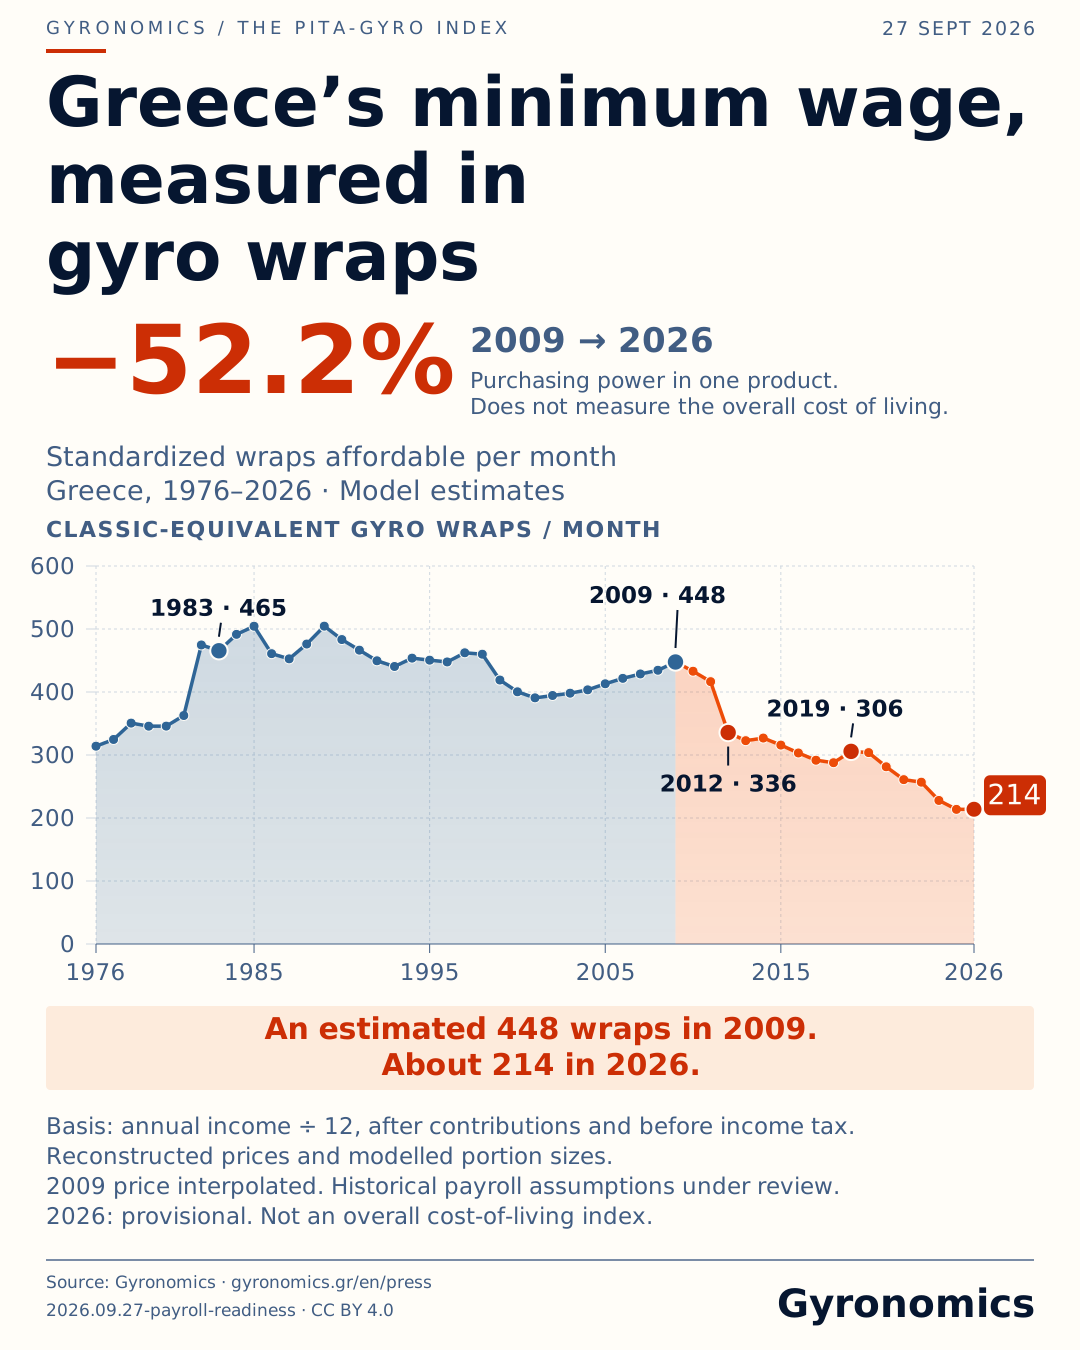
The series ends in 2026, with a gross minimum wage of 910 € per payment. For purchasing power, Gyronomics uses annual income after contributions divided by twelve: 919.72 €, equivalent to 214 classic gyros a month.
Scroll the table sideways to see all sources.
| Year | Gross per payment | After contributions / 12 | Classic gyros / month | Sources |
|---|---|---|---|---|
| 1976 | 14.93 € | 15.7 € | 314 | Evidence Wage source The year's legal act |
| 1985 | 98.54 € | 100.88 € | 504 | Evidence Wage source The year's legal act |
| 2002 | 494.5 € | 485.19 € | 394 | Evidence Wage source |
| 2012 | 613.63 € | 597.78 € | 336 | Evidence Wage source |
| 2019 | 644.67 € | 632.89 € | 306 | Evidence Wage source |
| 2026 | 910 € | 919.72 € | 214 | Evidence Wage source |
The year's legal act: The series wage is the 12-month mean of the monthly register, not the amount in the act. The year's act is one of the sources of the register's months.
The historical amounts are nominal conversions to euros, not today's purchasing power. The comparison includes the annual payment schedule and contributions, before income tax. It is not the take-home amount of each payslip.
Compare wages and purchasing power1976-2001: the drachma era
Through the 1980s and 1990s nominal wages rose fast, but double-digit inflation ran alongside them. In 1998, the last documented year before the euro, the net minimum wage bought 460 classic wraps a month.
National collective agreements set the floor, with indexation that often lagged behind prices.
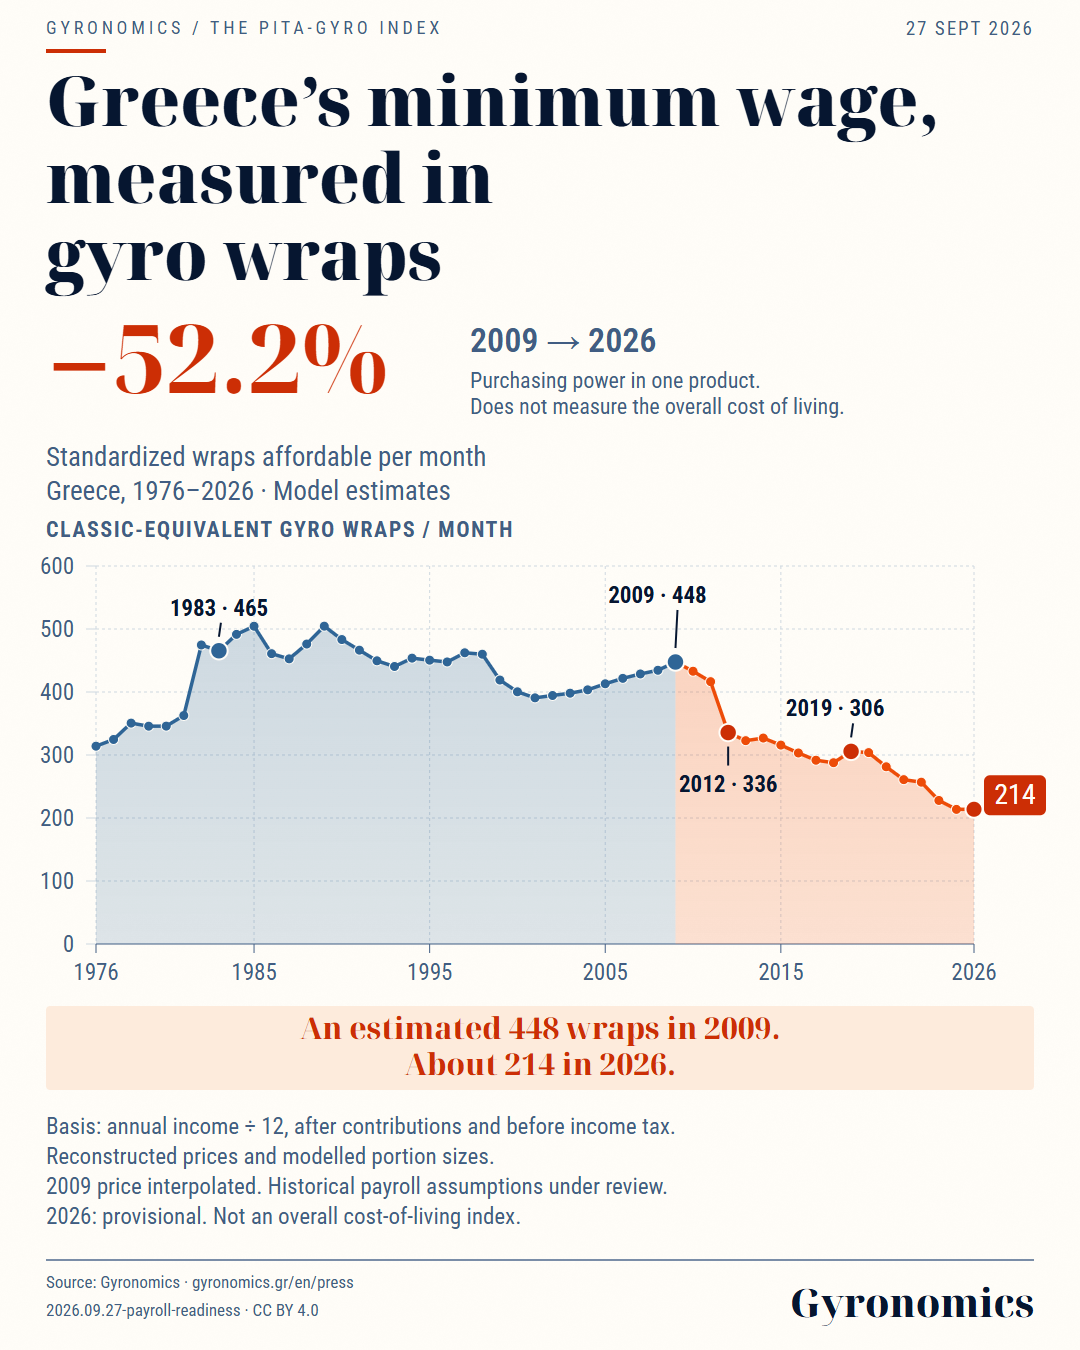
Greece’s minimum wage, measured in gyro wraps
The journey from 1976 to 2026. About 214 classic-equivalent gyros per month in the latest series year.
SVG, source and notes
- Wage basis: annual income ÷ 12, after employee contributions and before income tax.
- Reconstructed prices and modelled portions. Historical payroll assumptions remain under review.
- 2026: provisional. A one-product indicator, not the overall cost of living.
Release: 2026.09.27-payroll-readiness · CC BY 4.0
Immutable image dataset2002-2009: the euro and stabilisation
Euro entry pushed inflation into single digits. In 2002 the index stood at 394 classic wraps a month, the lowest of those eight years; by 2009 it had risen to 448.
It also started the familiar sense of price rounding, which showed up clearly in food service.
2010-2018: bailouts and a deep cut
In 2012 the minimum wage was cut by law by 22% (more for under-25s). It is the only stretch in the series where the nominal wage falls.
Prices did not fall in step, so purchasing power lost twice over.
2019-2026: raises and food-service inflation
Since 2019 the minimum wage has risen almost every year, reaching 910 € gross in 2026. Over the same period the gyro went from 2.30 € to 4.30 €.
The result: the 2026 index sits at 214 classic wraps, below its 2002 level.
See the same numbers live in the interactive dashboard.
The figures in this article are not written by hand: they are computed from the data series and change when it does. Price and wage coverage: price collection of September 2026, catering CPI to August 2026, minimum wage in force since 1 April 2026. Dataset version 2026.10.10-monthly-bulletin, last updated 2026-10-10.