20 August 2026· ≈ 2 min read· figures updated 10 October 2026 (release 2026.10.10-monthly-bulletin)
A wage in euros tells half the story. The question everyone understands is simple: how many gyros does the wage buy.
In this article
The problem with euros
Greece's 1998 minimum wage was 413.07 € net per month in today's currency; in 2026 it is 919.72 €. At first glance that is a huge raise. In reality it says nothing, because prices moved too.
Official inflation solves this, but abstractly: indices, baskets, weights. Few people can say off the top of their head what "CPI rose 3.1%" means in practice.
How is the index calculated?
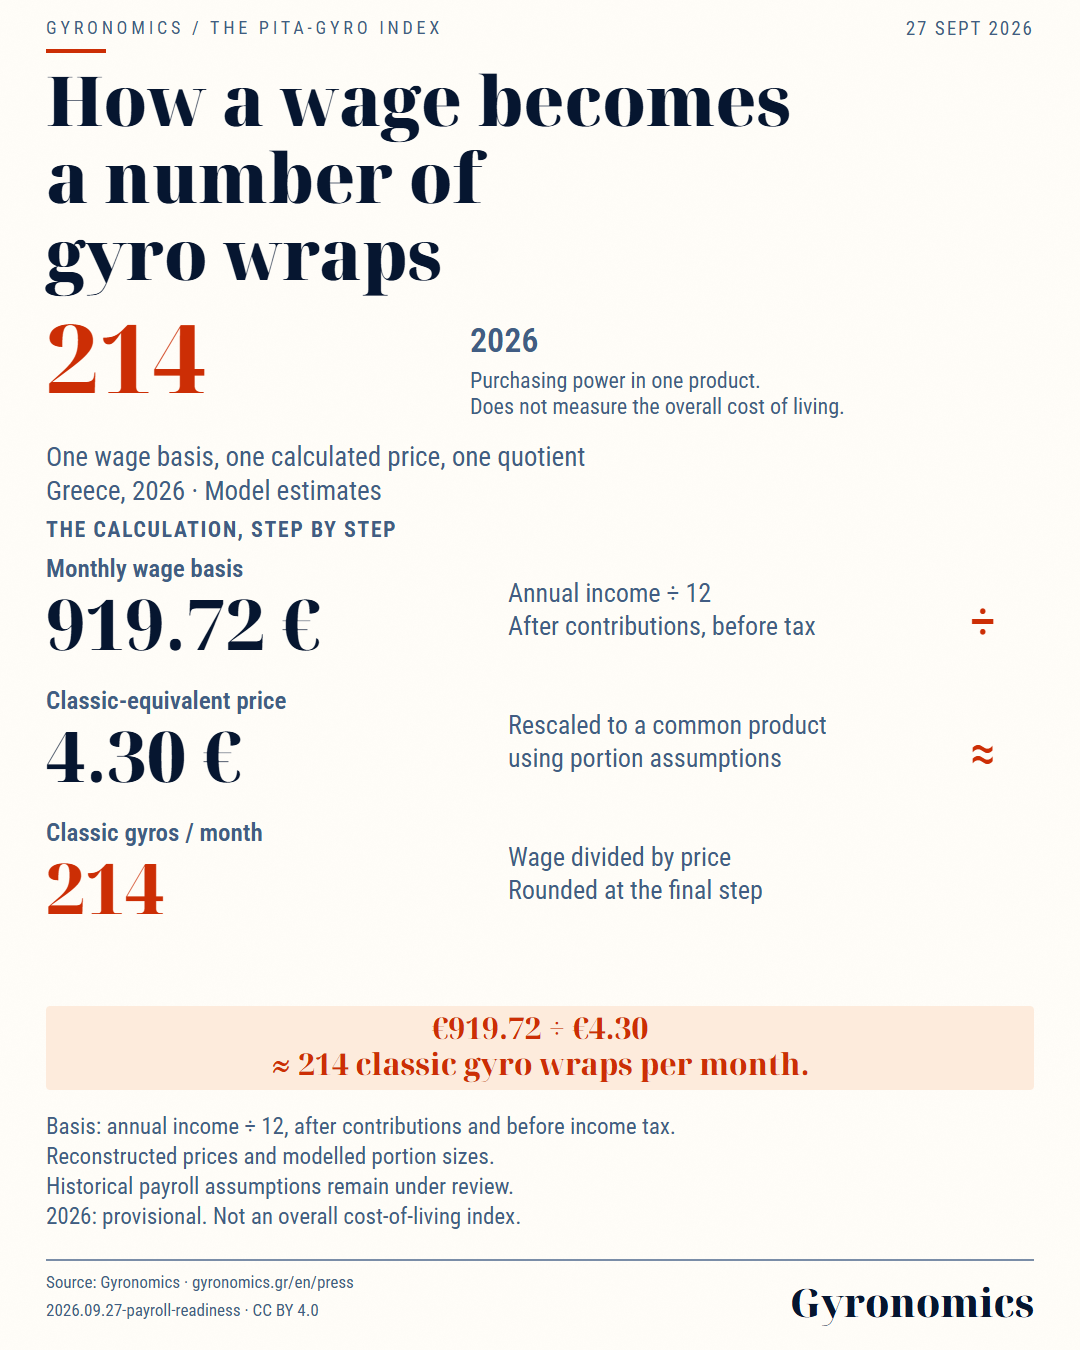
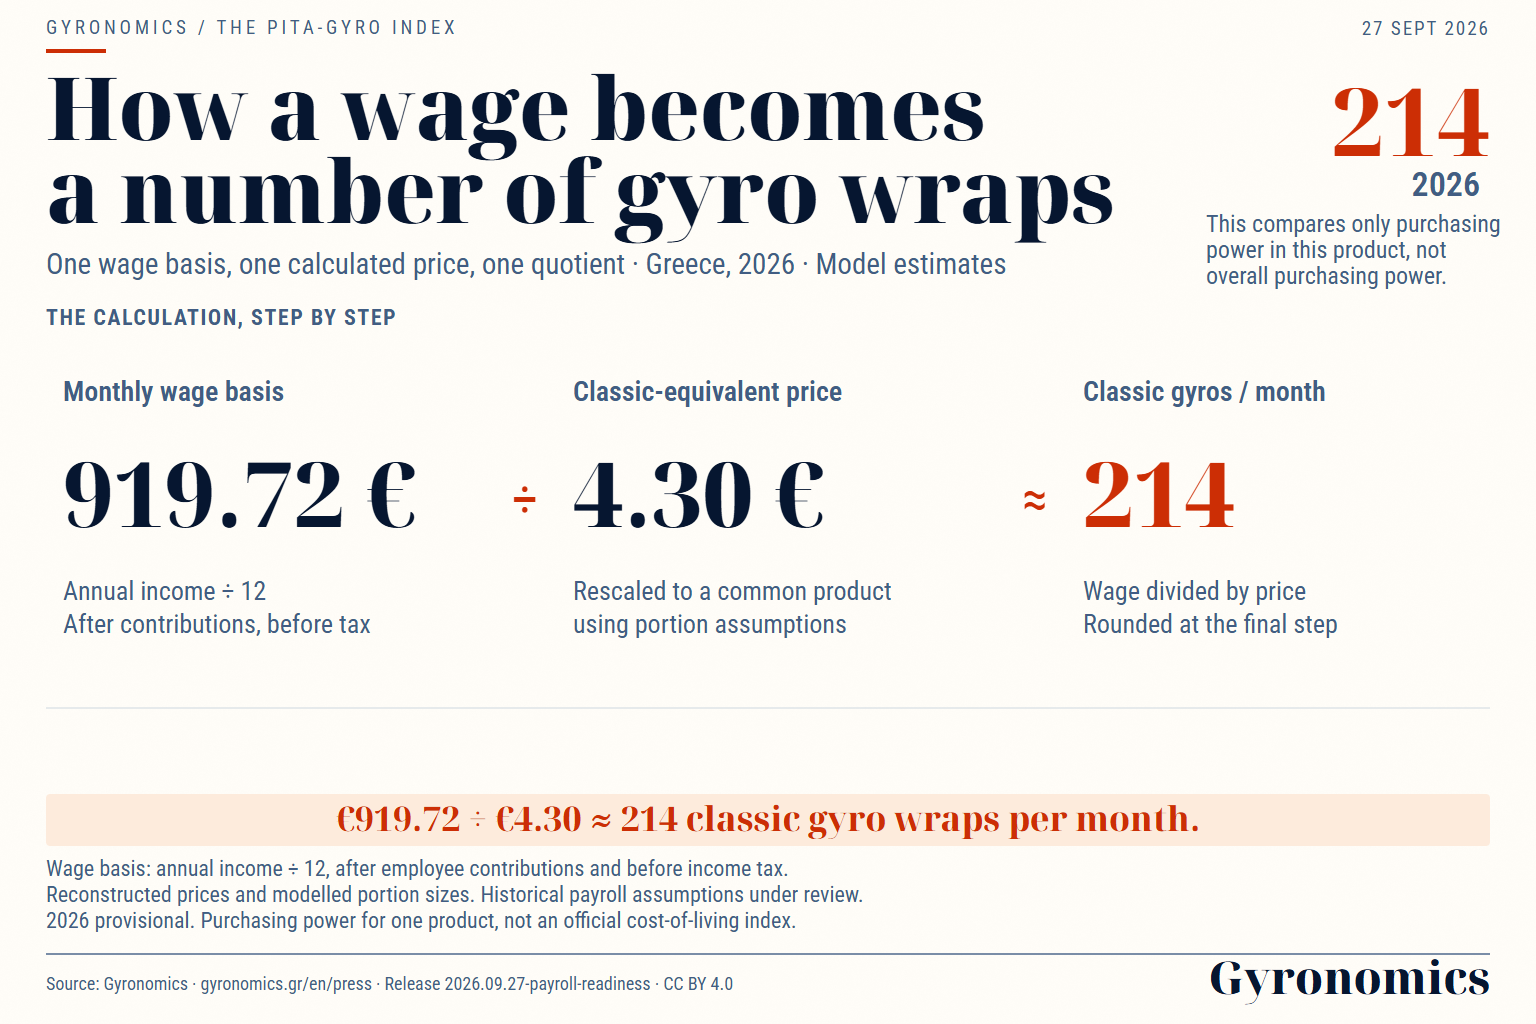
2026: annual income ÷ 12 = €919.72 per month. Dividing by the calculated classic price of €4.30 gives about 214 classic-equivalent gyros.
SVG, source and notes
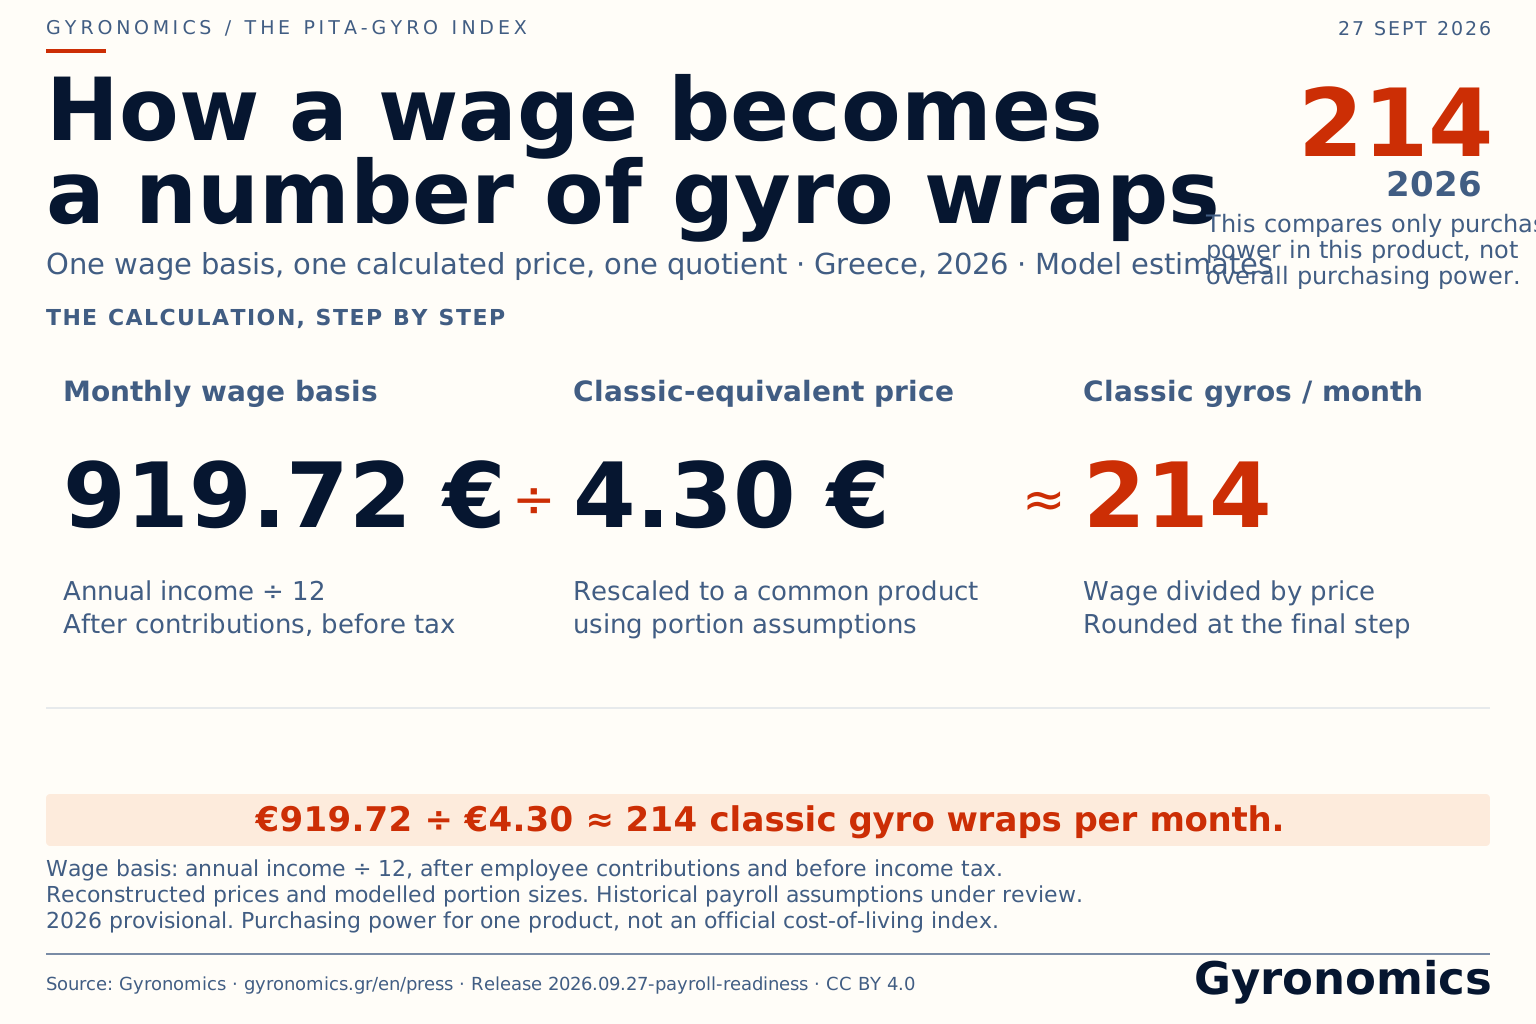
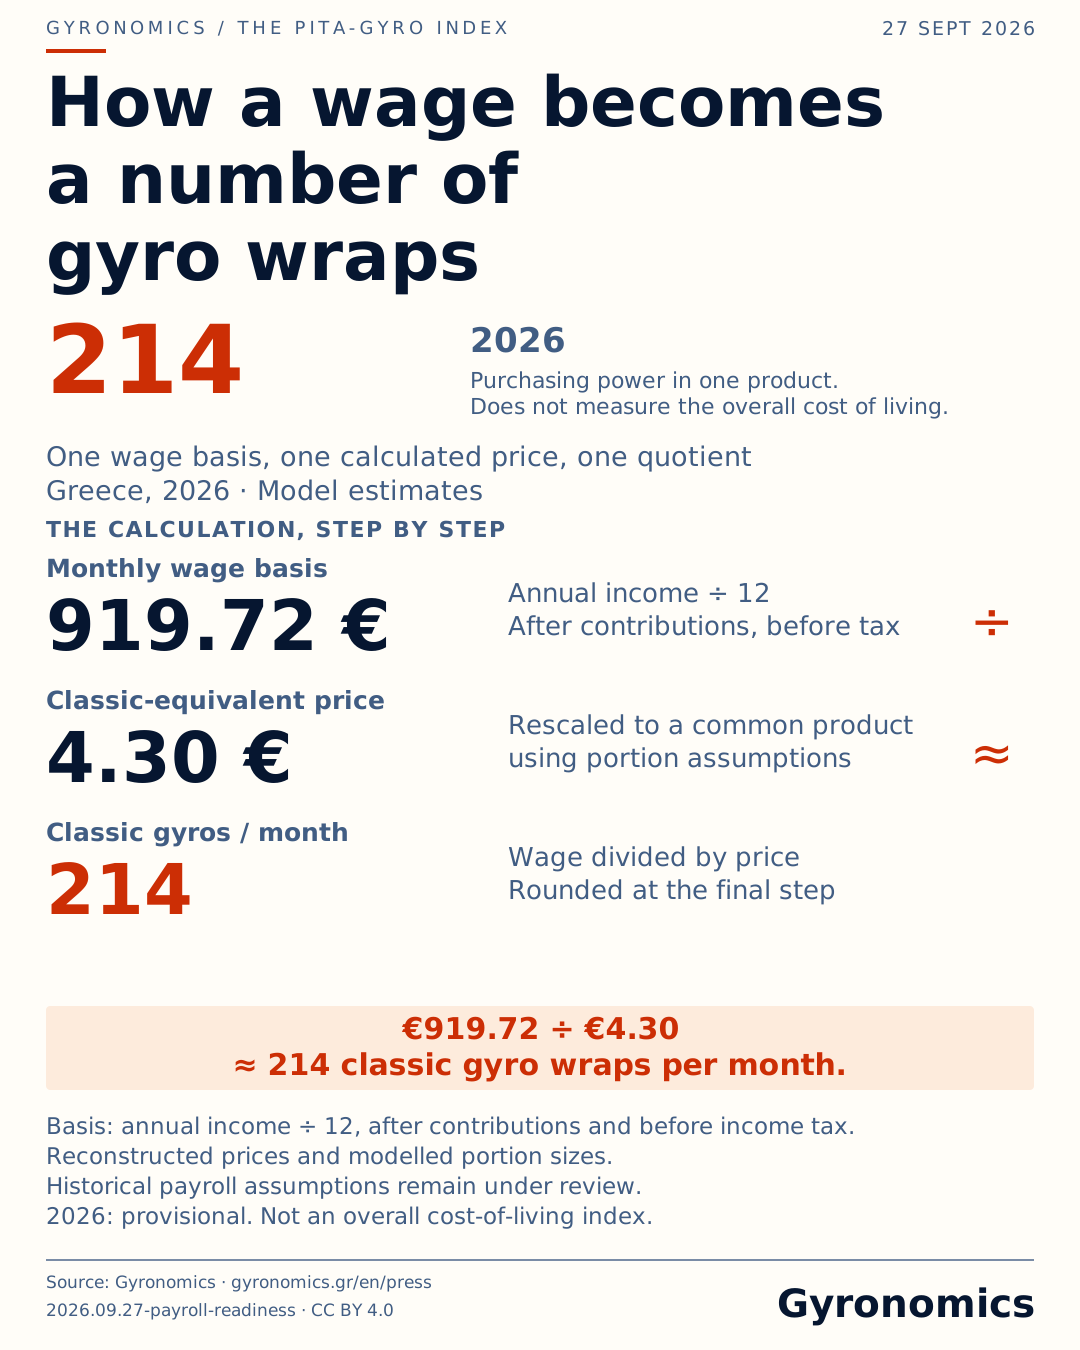
- Wage basis: annual income ÷ 12, after employee contributions and before income tax.
- Reconstructed prices and modelled portions. Historical payroll assumptions remain under review.
- 2026: provisional. A one-product indicator, not the overall cost of living.
Release: 2026.09.27-payroll-readiness · CC BY 4.0
Immutable image datasetWhy a gyro works as a unit
The pita gyro is close to an ideal comparison currency: every age group and income bracket buys it, it exists in every neighbourhood, and the product has stayed recognisably the same for decades.
It also bundles most of the economy's costs: meat, energy, shop rent, staff wages, VAT. When its price moves, something real has changed.
What the index shows
The Pita-Gyro Index is one division: net minimum wage divided by the gyro price rescaled to today's classic wrap - otherwise each year would measure a different product. In 1998 that gave 460 classic wraps a month, in 2002 394, and in 2026 214.
It is not a nutrition metric. It is a purchasing-power metric expressed in a unit people already carry in their heads.
Where the limits are
The index tracks the minimum wage, not the average one. It ignores housing, income tax beyond social contributions, and local price differences.
That is why Gyronomics always shows three price-scenario variants alongside it, so you can see how much the answer depends on the assumptions.
See the same numbers live in the interactive dashboard.
The figures in this article are not written by hand: they are computed from the data series and change when it does. Price and wage coverage: price collection of September 2026, catering CPI to August 2026, minimum wage in force since 1 April 2026. Dataset version 2026.10.10-monthly-bulletin, last updated 2026-10-10.