Minimum-wage income
x1.90
+89.6%
2002 → 2026 · Calculated series monthly equivalent
How did income, general CPI and gyro prices move? Choose a period and product. The conclusion follows your selected figures.
After contributions, before income tax. Annual income divided by 12, using 14 payments throughout the series. Wage and contributions are twelve-month means. Purchasing power in classic gyros.
x1.90
+89.6%
2002 → 2026 · Calculated series monthly equivalent
x1.62
+61.5%
2002 → 2026 · Cumulative change in the price level
x3.50
+249.6%
2002 → 2026 · Price ratio for the selected product
From 2002 to 2026, series income deflated by general CPI increased by 17.4%. The number it buys in classic gyros decreased by 45.8%. The two calculations use different denominators. Neither measures overall living standards.
Percentages use ratios before rounding to whole gyros. These are Gyronomics calculations, not official wage or welfare statistics.
Chain of the stored annual-average CPI changes, not December changes. Historical rates are rounded. Includes a provisional full-year assumption for 2026, not a final annual observation. CPI source
Levels with a common starting point, not annual inflation rates. Lines use different patterns as well as colours.
Income: 189.6 · General CPI: 161.5 · Classic gyros: 349.6 · Year sources
Each row belongs to the selected period and product. CSV and JSON retain all selected years, base-100 levels, underlying amounts and evidence context.
| Year | Income (100) | CPI (100) | Price (100) | Income € | Price € | Gyros/month | Price evidence |
|---|---|---|---|---|---|---|---|
| 2002 | 100.0 | 100.0 | 100.0 | 485.19 | 1.23 | ≈394 | B · Regulated, single-source or an estimate with a range |
| 2003 | 105.0 | 103.5 | 104.1 | 509.60 | 1.28 | ≈398 | C · Interpolated between model anchors |
| 2004 | 110.4 | 106.5 | 108.0 | 535.73 | 1.33 | ≈403 | C · Interpolated between model anchors |
| 2005 | 116.9 | 110.2 | 111.6 | 567.09 | 1.37 | ≈413 | C · Interpolated between model anchors |
| 2006 | 124.0 | 113.8 | 116.0 | 601.72 | 1.43 | ≈422 | C · Interpolated between model anchors |
| 2007 | 130.8 | 117.1 | 120.3 | 634.39 | 1.48 | ≈429 | C · Interpolated between model anchors |
| 2008 | 138.9 | 122.0 | 126.1 | 673.91 | 1.55 | ≈435 | C · Interpolated between model anchors |
| 2009 | 146.8 | 123.4 | 129.3 | 712.17 | 1.59 | ≈448 | C · Interpolated between model anchors |
| 2010 | 149.4 | 129.2 | 136.1 | 724.77 | 1.67 | ≈433 | C · Interpolated between model anchors |
| 2011 | 150.2 | 133.5 | 142.3 | 728.74 | 1.75 | ≈416 | B · Regulated, single-source or an estimate with a range |
| 2012 | 123.2 | 135.5 | 144.8 | 597.78 | 1.78 | ≈336 | C · Interpolated between model anchors |
| 2013 | 117.7 | 134.3 | 143.8 | 570.94 | 1.77 | ≈323 | C · Interpolated between model anchors |
| 2014 | 118.4 | 132.5 | 142.8 | 574.36 | 1.76 | ≈327 | C · Interpolated between model anchors |
| 2015 | 119.1 | 130.3 | 148.8 | 577.78 | 1.83 | ≈316 | B · Regulated, single-source or an estimate with a range |
| 2016 | 118.7 | 129.2 | 154.4 | 575.78 | 1.90 | ≈303 | C · Interpolated between model anchors |
| 2017 | 118.4 | 130.7 | 160.1 | 574.36 | 1.97 | ≈292 | C · Interpolated between model anchors |
| 2018 | 118.4 | 131.4 | 162.3 | 574.36 | 2.00 | ≈288 | C · Interpolated between model anchors |
| 2019 | 130.4 | 131.8 | 168.3 | 632.89 | 2.07 | ≈306 | A · Model price anchor; source verification is separate |
| 2020 | 132.1 | 130.3 | 171.5 | 640.75 | 2.11 | ≈304 | B · Regulated, single-source or an estimate with a range |
| 2021 | 134.2 | 131.8 | 188.2 | 651.26 | 2.32 | ≈281 | A · Model price anchor; source verification is separate |
| 2022 | 144.0 | 144.5 | 217.8 | 698.89 | 2.68 | ≈261 | A · Model price anchor; source verification is separate |
| 2023 | 158.1 | 149.5 | 242.8 | 766.95 | 2.99 | ≈257 | B · Regulated, single-source or an estimate with a range |
| 2024 | 169.3 | 153.4 | 293.1 | 821.46 | 3.61 | ≈228 | A · Model price anchor; source verification is separate |
| 2025 | 180.7 | 157.7 | 333.6 | 876.77 | 4.10 | ≈214 | A · Model price anchor; source verification is separate |
| 2026Provisional CPI | 189.6 | 161.5 | 349.6 | 919.72 | 4.30 | ≈214 | B · Regulated, single-source or an estimate with a range |
485.19 € ÷ 1.23 € ≈ 394
Price input evidence: B Regulated, single-source or an estimate with a range
Range from price bounds: 326–418 classic gyros/month
Base series · classic gyros/month · scenario start 1998
485.19 € ÷ 1.230 € ≈ 394 classic gyros/month
After contributions, before income tax. Annual income divided by 12, using 14 payments throughout the series. Wage and contributions are twelve-month means. Purchasing power in classic gyros.
The quotient is rounded to a whole number.
Only the price varies within its published bounds. Wage and composition stay fixed. This is neither a total uncertainty range nor a statistical confidence interval. Bounds come from the anchor's configured range.
Estimate with range
Selected estimate with a modelling range, without a directly documented price.
Estimate EUR 1.24, range 1.17-1.50. Lower bound: the campaign's EUR 1.17 (399 GRD), that is no change across the changeover. Upper bound: the largest increase recorded by the Rizospastis survey of January 2002 (“up to 46%, from 350 drachmas to 1.5 euro”). The central value is 2001 carried forward with the official 2002 catering CPI (6.3%).
Anchors used by the calculation: 2002
Product rescaling
1.24 € × 0.992 ≈ 1.230 €
Historical meat weights and changes in composition are model assumptions, not a series of market measurements. The assumed peak and decline in portion size need verification. The present-day weight defines the reference product. The era price refers to the wrap sold at the time; the classic price and weight-adjusted index depend on these assumptions.
What do the sources support?
B: Regulated, single-source or an estimate with a range
Categories describe how the price enters the model. They do not certify original-source verification, representative sampling or historical product composition.
919.72 € ÷ 4.30 € ≈ 214
Price input evidence: B Regulated, single-source or an estimate with a range
Range from price bounds: 194–238 classic gyros/month
Base series · classic gyros/month · scenario start 1998
919.72 € ÷ 4.300 € ≈ 214 classic gyros/month
After contributions, before income tax. Annual income divided by 12, using 14 payments throughout the series. Wage and contributions are twelve-month means. Purchasing power in classic gyros.
The quotient is rounded to a whole number.
Only the price varies within its published bounds. Wage and composition stay fixed. This is neither a total uncertainty range nor a statistical confidence interval. Bounds come from the model's selected percentage band.
Soft anchor
The price blends the CPI path with the anchor input, is constrained by its range and is rounded to menu-price steps. The input does not directly replace the final price.
3 sources, rescaled to the reference basket: ant12026 EUR 4.25 -> EUR 4.25 (35%) · psitopoles2026 EUR 3.95 -> EUR 3.95 (27%) · gyronomics2026 EUR 4.12 -> EUR 4.12 (39%). Weighted mean EUR 4.12.
Anchors used by the calculation: 2026
Product rescaling
4.30 € × 1.000 ≈ 4.300 €
Historical meat weights and changes in composition are model assumptions, not a series of market measurements. The assumed peak and decline in portion size need verification. The present-day weight defines the reference product. The era price refers to the wrap sold at the time; the classic price and weight-adjusted index depend on these assumptions.
What do the sources support?
B: Regulated, single-source or an estimate with a range
Categories describe how the price enters the model. They do not certify original-source verification, representative sampling or historical product composition.
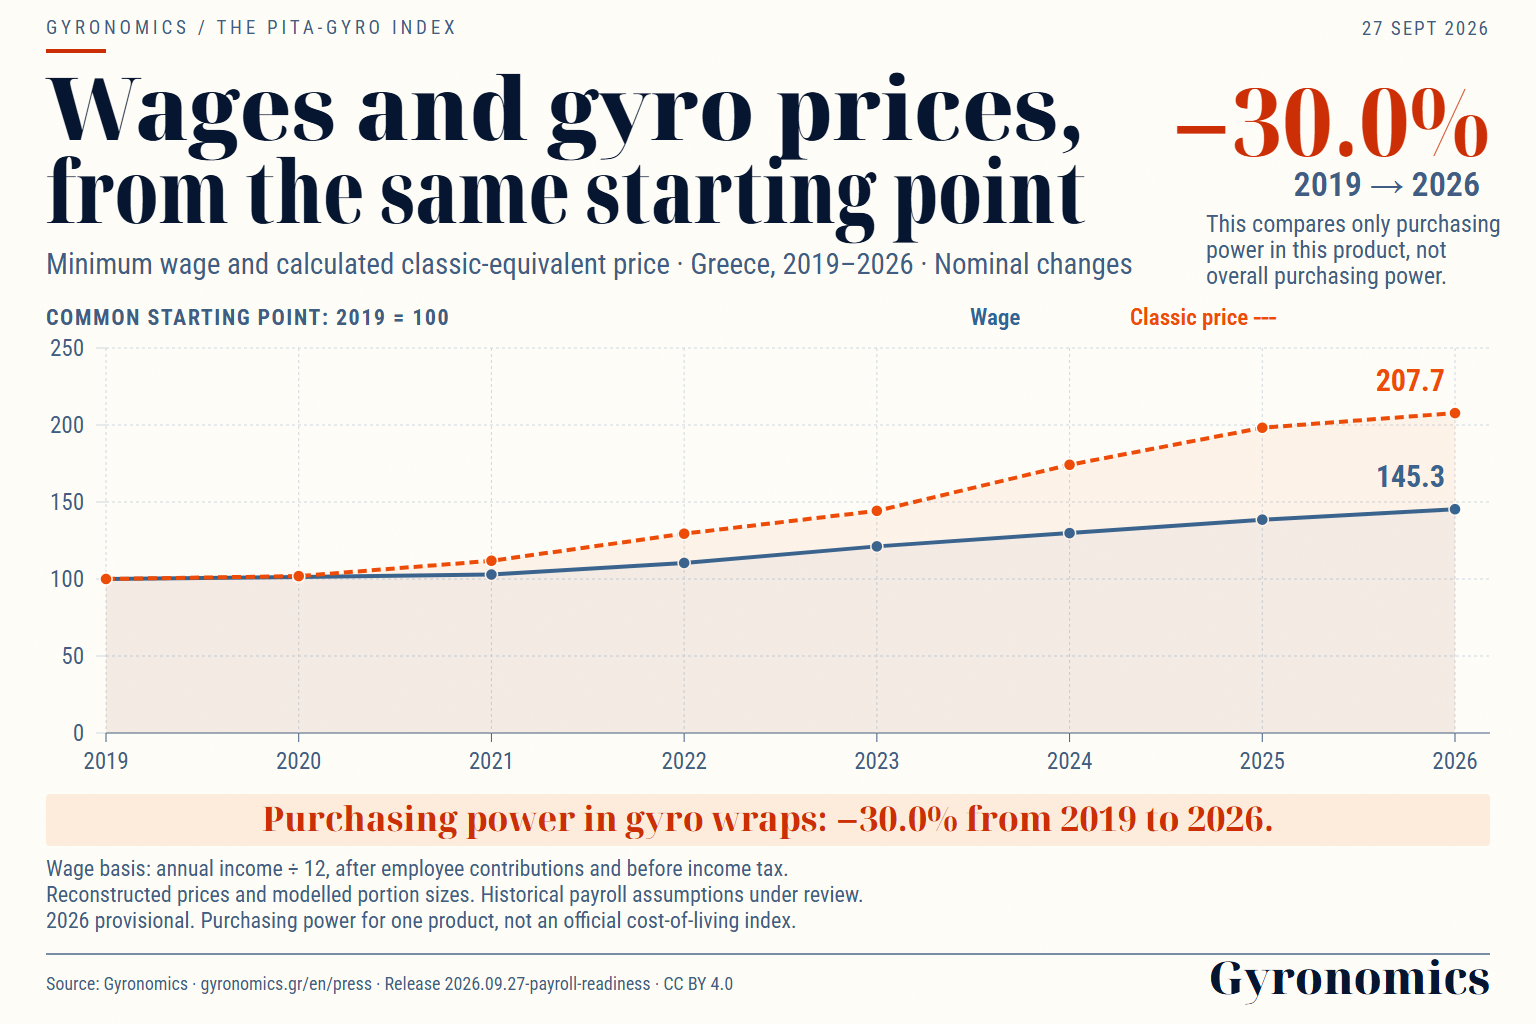
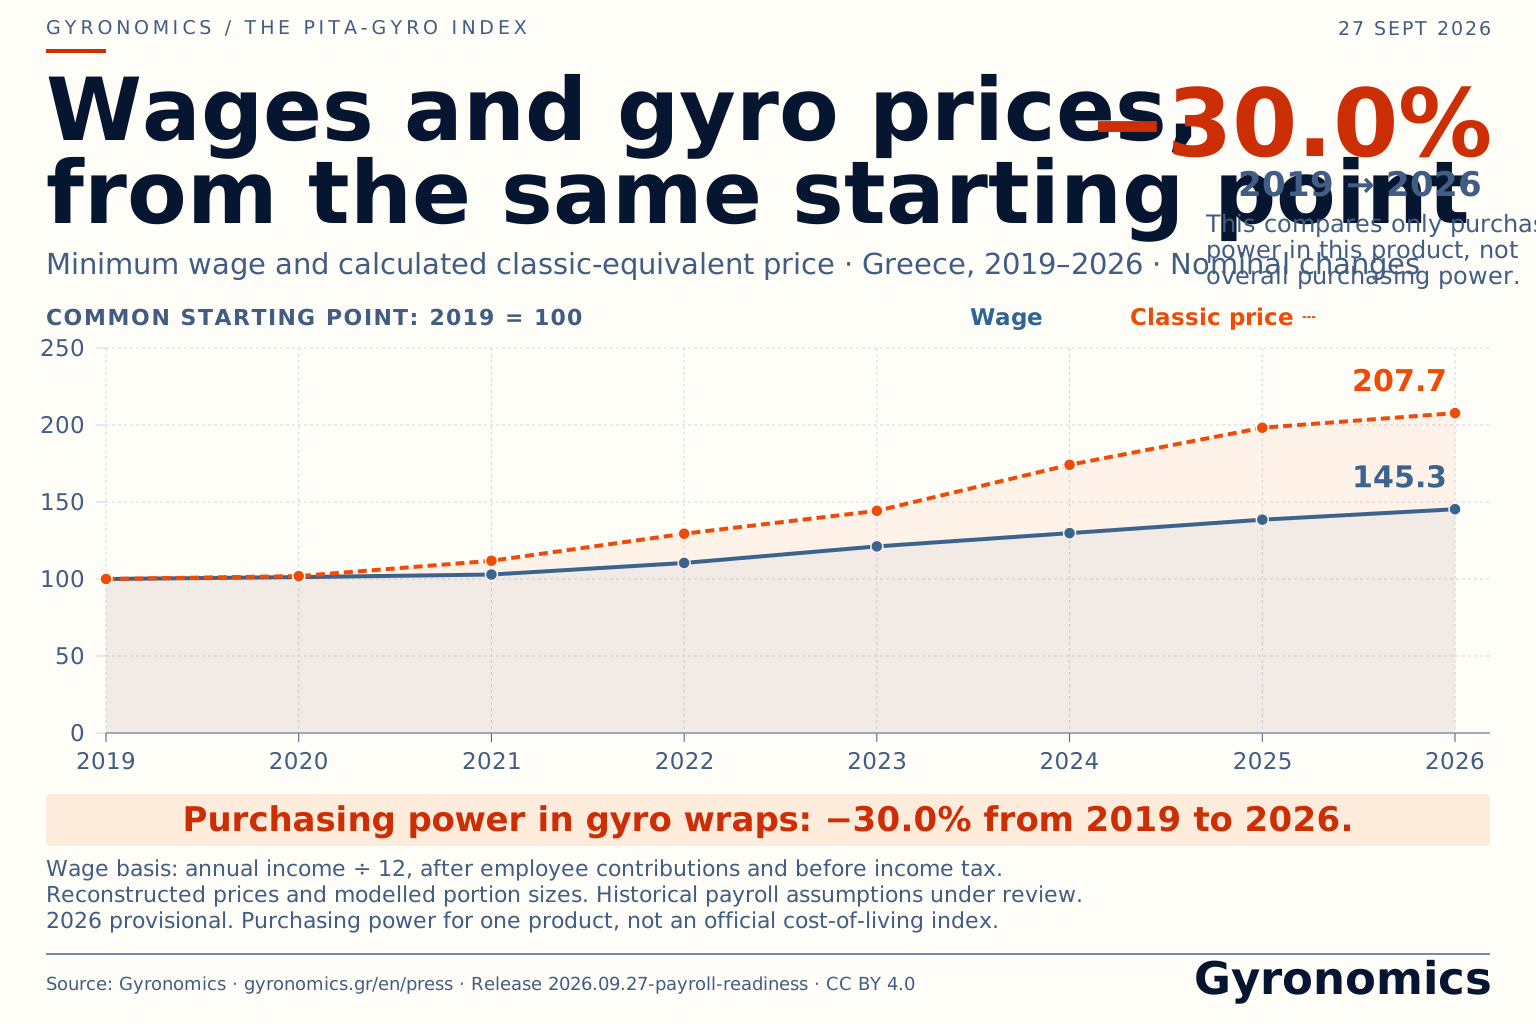
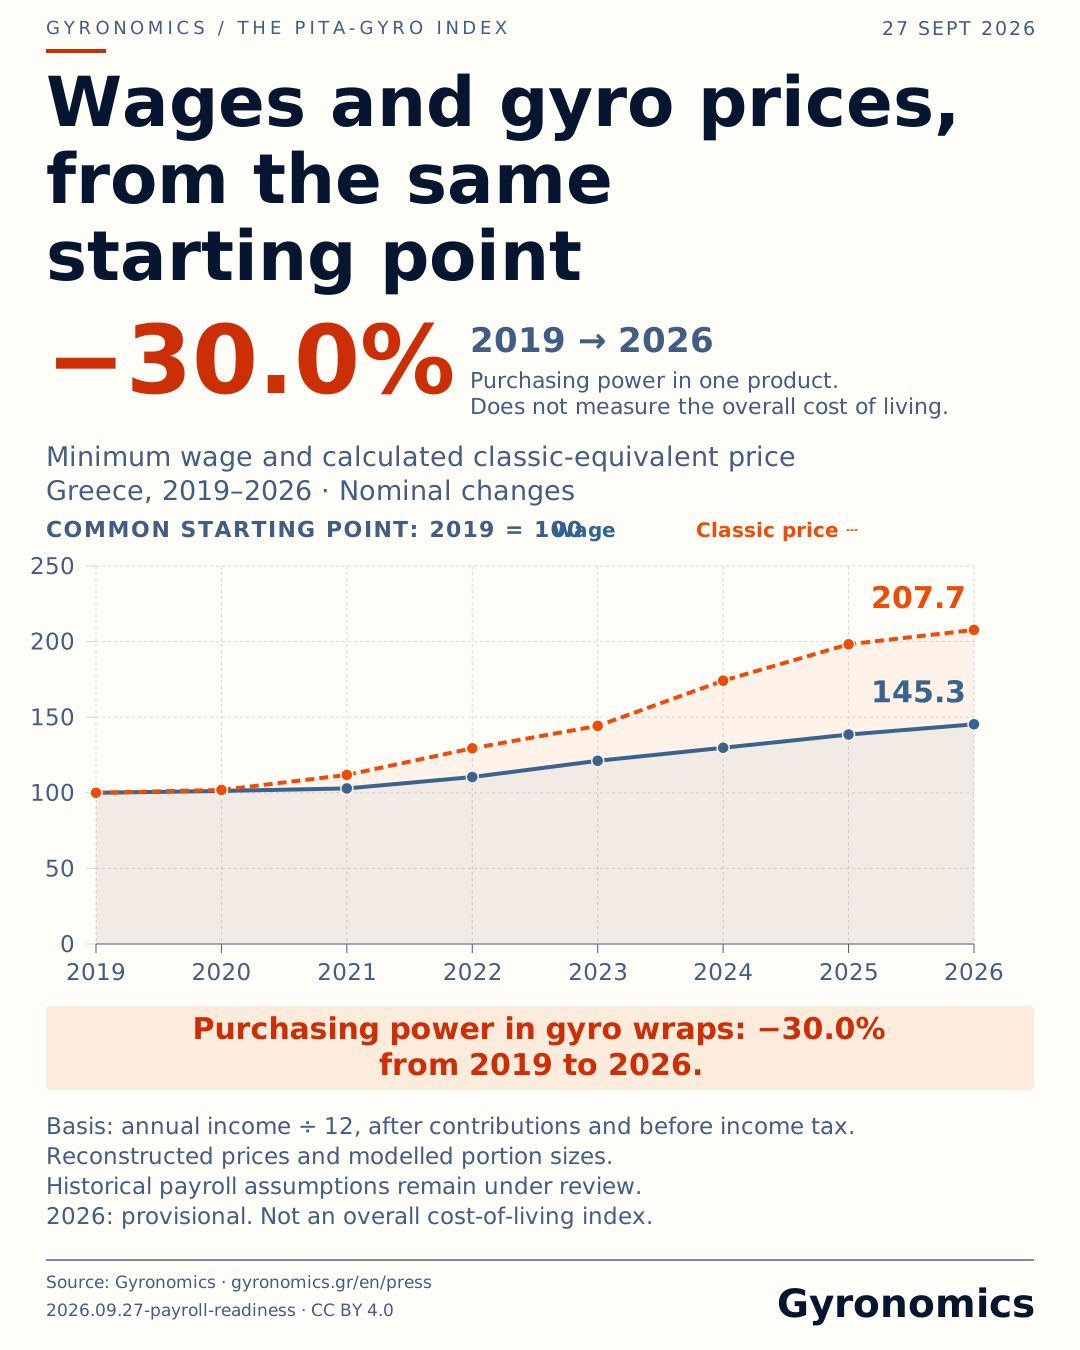
The image below has its own reference period, independent of the tool’s selections.
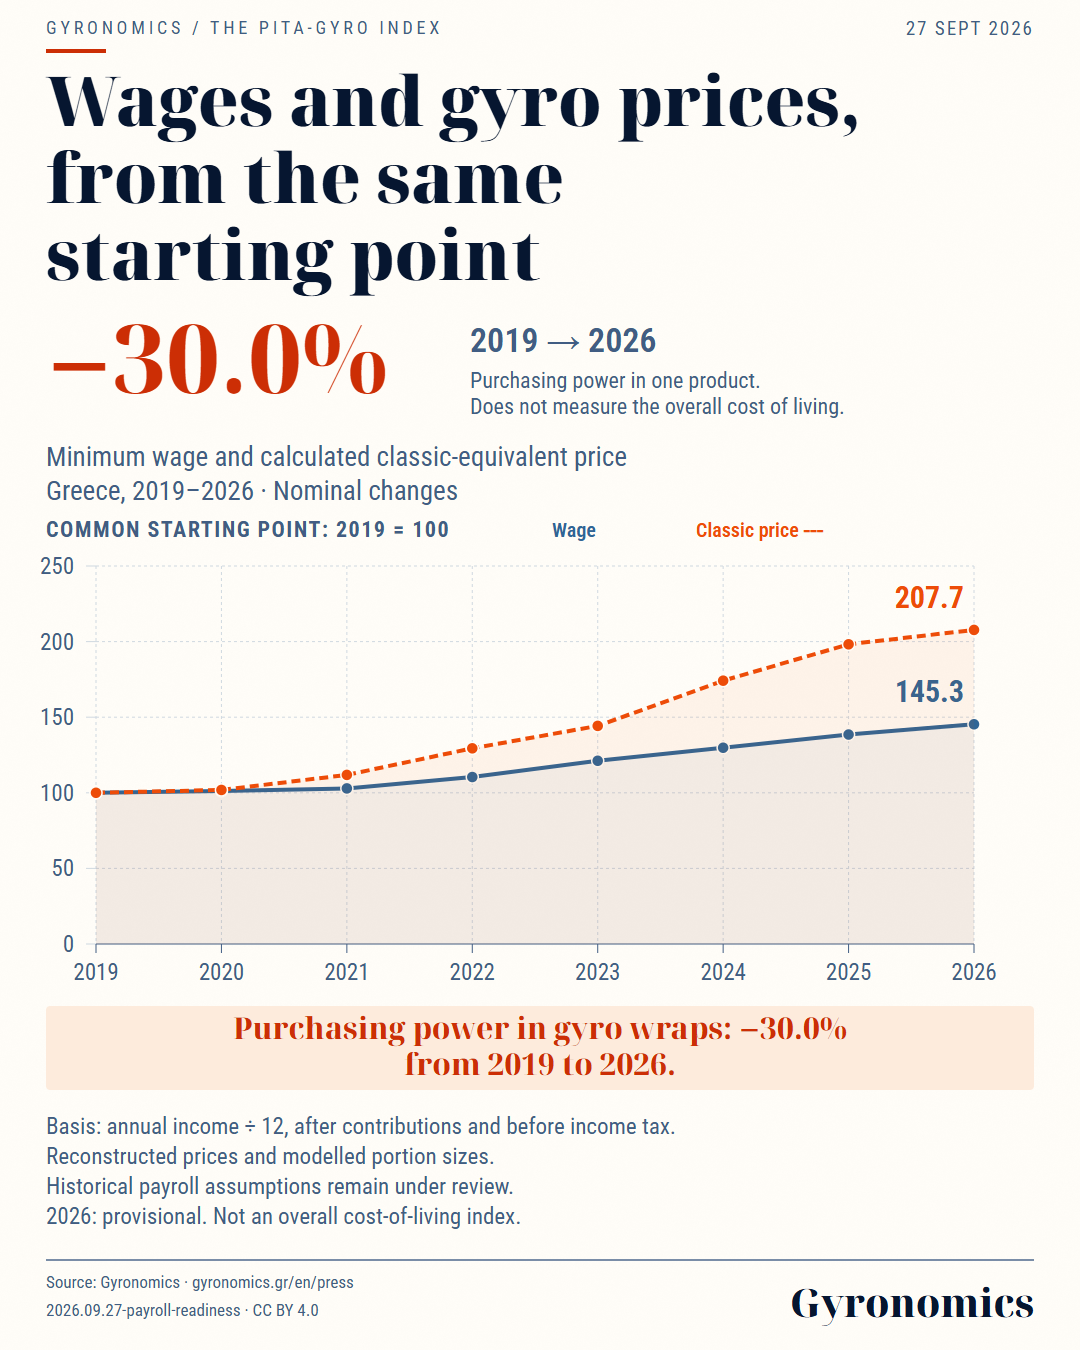
Did wages keep pace with the price?
Wage and calculated classic-gyro price, both starting at 2019 = 100. Nominal changes.
Release: 2026.09.27-payroll-readiness · CC BY 4.0
Immutable image datasetPrice and wage coverage: price collection of September 2026, catering CPI to August 2026, minimum wage in force since 1 April 2026. Dataset version 2026.10.10-monthly-bulletin, last updated 2026-10-10.